Wednesday, 4 January 2012

Price Trading Volume and Open Interest

The price is not the only weighty factor to be considered while analyzing Forex market. Besides the currency exchange rate, its trading volume plays an important role, too. There is the postulate of Dow theory that tells the trend must be confirmed by the trading volume. Unfortunately, Forex does not let us evaluate the cash-equivalent of its trading volume at a specific timeframe. As the currency exchange has no definite place where the trades are carried out, the currency is exchanged throughout the world by the bank-network. That means nobody can count the total cash flows in those international trades. For an approximate calculation one could, perhaps, use the data of currency futures trading volumes, because the futures market in regard to such contracts has a strong correlation with Forex market. But to get even an approximate idea of Forex cash volume, it would be necessary to consider a whole batch of futures markets existing in the world. And that seems impossible, too. That’s why one uses other approach to evaluate the trading volume on the currency exchange.
Indeed, one should not consider the Forex trading volume at the moment when you have to meet a decision, whether to open or to close a position, because it is not quite correctly. In this case several big banks, comprising billions of funds, could create an appearance of the interest in any currency. It’s helpful thus to analyze not the cash volumes, but the amount of trades made during the trading period under examination. For the approximate evaluation of that indicator there is on the Forex the trading volume of a market-maker. As usual, only changed quotes are set under consideration apart of all the amount of quotes remaining untouched. The faster a price varies, the more seems obvious the market interest in supporting current trend.
Thus, instead of trading volume, we take the rate of quotations change of the market-maker as an appropriate tool in technical analysis on a certain timeframe. The trading volume is the second most significant indicator (after the price), that trader analyzes accurately. Analyzing the trading volume one plots a specific chart - trading volume histogram, where the values are represented in bars of various heights. Each of the bars corresponds to its timeframe, according the chosen scale (1 min, 5 min, 15 min and so on). The height of a bar is determined by the value the trading volume, the higher bar, the faster is a rate of market-maker quotations change. Histograms, as usual, are inserted at the bottom of the price charts. In this case every bar of the histogram complies with one of the chart’s shape (bar or candle) and sets the volume of trades made in a certain time space, represented by that shape. Trading volume histograms do not comprise the information about activity of “bulls” and “bears”, i.e. the diagram doesn’t let us understand what kind of operation having been prevailed during the trading time-period: sell or buy. But such information is excessive, because the market favor could be easily discerned by a price chart. It is to notice, that the trading volume, as a rule, is ahead of the price movements, as the quotes are more inert comparing to the volumes indicator. If the price growth happens at the increasing trade volumes, and then if the volume sheds, the price still climbs for a while, and only after it drops down. Thus, any changes in trading volumes could be a good sign for the ease or turn of the market trend, and we should never disregard this while testing the currency market. Always make the histograms of trading volumes underneath the price charts while you analyze Forex! The day and week volumes are the most important ones for the analysis.
The third important figure in technical analysis of currency market (after price and volume) is an open interest, otherwise, an unclosed contracts volume at the end of a trading period. It is not an absolute value of this figure that has any significance, but its fluctuation: up or down motion.
The growth of the trading interest could serve as a good indicator for the long-term preferences. If a position keeps being unclosed It means, that the trader supports an existing trend for the long future. But superfluous extension of the trading interest can be a sign of the market turnaround, as traders are going to close their positions fixing the profit. The open interest diagram is placed, as usual, between the trading volume histogram and price chart. But this diagram is not in use on Forex. As the trading on Forex has no any specific place for trade, it is impossible to fix the open interest volume.
In the summary of this chapter we shall again pay attention onto the postulate of Dow theory: the volumes must prove the trend. By the growing or descending trend the price movement often occurs along the direction of the main trend at the growing trade volumes, and the price cross-movement occurs by decreasing volumes. You should always draw a trading volume histogram next to the price chart bottom when you analyze or make prospects for your future speculations on Forex.

8 Largest Forex Trading Centers in the World

Forex Trading Global Turnover
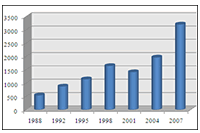
Forex market trading is truly a global phenomenon as well as the largest financial market in the world with over $4 trillion changing hands on a daily basis. Looking at the most recent Bank of International Settlements foreign-exchange report, published every three years, we get a clear view of where most of the daily forex trading volume takes place. Many of the usual suspects like the UK and USA are found at the top of the list for the largest fx trading centers while others such as Singapore may be more surprising to many.

1. United Kingdom
 The UK and its financial center of London participate in the largest percentage of overall global forex daily trading volume of any geographical location. UK daily trading volume increased from 35 percent in 2007 to a total of 37 percent of the world’s overall trading volume in 2010, according to the BIS data. Total daily trading volume rose by just about 25 percent since 2007 when dollar volume equaled $1,483 billion to 2010 when volume stood at $1,854 billion per day. A more recent report has shown daily volume just passed the 2,000 billion mark in April 2011.
Financial Capital: London
Average Daily Trading Volume: $1,854 billion
Percentage of Daily Global Forex Volume: 37 %
Bank of England
2. United States 
The United States comes in second in daily trading volume and is the largest country on the list with over 300 million people. The US amounted to a total of 18 percent of the daily global forex volume in 2010 following a 17 percent share of the volume in 2007. The total dollar amount traded increased by approximately 20 percent to $904 billion a day in 2010 from a total of $745 billion in 2007.
Financial Capital: New York City
Average Daily Trading Volume: $904 billion
Percentage of Daily Global Forex Volume: 18 %
Wall Street
3. Japan 
Japan is the third-largest forex trading center with a total of 6 percent of global foreign exchange turnover taking place in this country of 128 million people. Japan also amounted to 6 percent of the global turnover in 2007 following an 8 percent share in 2004. Total dollar amount of trading surged by over 20 percent from 250 billion in 2007 to a total of 312 billion in 2010.
Financial Capital: Tokyo
Average Daily Trading Volume: $312 billion
Percentage of Daily Global Forex Volume: 6 %
Japan-Tokyo
4. Singapore 
Singapore is up next with a total of 5 percent of the world’s daily forex trading volume. This small country of roughly 5 million people averaged $266 billion of total daily volume in 2010. This was an increase from a total of $242 billion in 2007 which accounted for 6 percent of the overall global forex trade.
Financial Capital: Singapore
Average Daily Trading Volume: $266 billion
Percentage of Daily Global Forex Volume: 5 %
Singapore
5. Switzerland
Switzerland was the fifth-largest forex trading center in 2010 with 5 percent of the total global volume which was small a decrease from 2007 when it accounted for 6 percent of daily volume. This European country of roughly 8 million people is famous for its banking sector and is one of the richest countries in the world on a GDP per capita basis. Total daily volume increased to $263 billion in 2010 from a total of $254 billion in 2007.
Financial Capital: Zurich, Geneva
Average Daily Trading Volume: $263 billion
Percentage of Daily Global Forex Volume: 5 %
Switzerland
6. Hong Kong
 Hong Kong follows Switzerland as the sixth largest trading center in 2010 with approximately 5 percent of forex daily trade volume. This is an increase from 4 percent in 2007 for this city-state on the southern coast of China which has an estimated population of 7 million people. Hong Kong’s total daily volume averaged $238 billion in 2010 which was over a 30 percent increase from 2007.
Financial Capital: Hong Kong
Average Daily Trading Volume: $238 billion
Percentage of Daily Global Forex Volume: 5 %
Hong Kong
7. Australia
Australia is next on the list with a 4 percent share of total forex daily volume which matches its 2007 volume share. Overall trading volume grew right around 9 percent from a total of $176 billion in 2007 to a total of $192 billion in 2010.
Financial Capital: Sydney
Average Daily Trading Volume: $192 billion
Percentage of Daily Global Forex Volume: 4 %
Sydney-Australia
8. France
Number eight on our list with right around a 3 percent share of the daily forex trading volume is France with its financial center of Paris. France also amounted to 3 percent of the daily global forex trade in 2007 and saw its daily total volume rise by roughly 20 percent from a total of $127 billion in 2007 to a total of $152 billion in 2010.
Financial Capital: Paris
Average Daily Trading Volume: $152 billion
Percentage of Daily Global Forex Volume: 3 %
Paris

Tuesday, 3 January 2012

Risk Comeback or Healthy Post Holiday Corrective Rally?

Market price action in 2012 thus far has been on the whole risk positive, with the moves likely the result of some short-term profit taking on flight to safety trade in the final weeks of the previous year. However, economic data has also been impressive, with a slew of PMIs out from China, Australia, Switzerland, UK and the Eurozone all exceeding expectations over the past two days, in addition to some other encouraging releases. Also seen propping sentiment has been the first Eurozone auction for the year out of Belgium, which was well received. The commodity currencies have unsurprisingly been the relative outperformers on familiar correlations, with Aussie back to some solid resistance in the 1.0300 area, Kiwi trading towards 0.8000, and CAD contemplating acceleration towards parity.
Risk_Comeback_or_Healthy_Post_Holiday_Corrective_Rally_body_audichi.png, Risk Comeback or Healthy Post Holiday Corrective Rally?
Still, we retain a broader risk off outlook and continue to recommend fading the strength in these commodity currencies, in favor of some material underperformance in 2012 as the global recession intensifies and spreads towards China. China’s Premier Wen Jiabao echoes our sentiment after saying that Q1 2012 will be hard for the Chinese economy. The EUR/AUD cross rate has been an interesting one to watch, with the market trading by +20 year lows and threatening a break to record lows below 1.2500. But given the extent of the rapid depreciation of some 85 big figures since 2008, we see the formation of a major base and trend reversal over the coming months. Our technical outlook aligns with our fundamental view, and we will be looking for opportunities to be buying aggressively over the coming days.
Relative performance versus the USD o Tuesday (as of 11:08GMT)
  1. NZD +1.23%
  2. AUD +1.10%
  3. CAD +0.85%
  4. EUR +0.80%
  5. CHF +0.72%
  6. GBP +0.51%
  7. JPY +0.22%
Although the holidays are finally behind us, it will take a few more days before investors can fully shake off their holiday hangovers and refocus on markets. Another currency which should be watched closely is the Yen, which managed to find some relative bids in the final days of 2011, particularly on the crosses, with EUR/JPY dropping through major psychological barriers at 100.00. While we are risk negative in our macro outlook, we also see the Yen at risk for relative underperformance even in this environment with the prospects for more official intervention looking increasingly probable to us. As such, any additional weakness below 100.00 in EUR/JPY, or below 76.55 in USD/JPY is seen limited in favor of a major bout of Yen selling over the coming months.
Looking ahead, the focus on Tuesday will be on any progress and developments (if at all) from talks between France’s Sarkozy and Germany’s Merkel. Meanwhile, on the data front, US construction spending, ISM manufacturing and the Fed Minutes are all slated for release. Global equity markets are well bid on the day thus far, while commodities are also tracking considerably higher.
ECONOMIC CALENDAR
Risk_Comeback_or_Healthy_Post_Holiday_Corrective_Rally_body_Picture_6.png, Risk Comeback or Healthy Post Holiday Corrective Rally?
TECHNICAL OUTLOOK
Risk_Comeback_or_Healthy_Post_Holiday_Corrective_Rally_body_eur.png, Risk Comeback or Healthy Post Holiday Corrective Rally?
EUR/USD: After finally taking out the 2011 lows from January by 1.2870, the market seems poised for the next major downside extension. Overall, we retain a strong bearish outlook for this market and look for setbacks to extend towards the 1.2000 handle over the coming months. While we would not rule out the potential for additional corrective rallies, any rallies should be very well capped above 1.3500.
Risk_Comeback_or_Healthy_Post_Holiday_Corrective_Rally_body_jpy2.png, Risk Comeback or Healthy Post Holiday Corrective Rally?
USD/JPY:Despite the latest pullbacks, we continue to hold onto our constructive outlook while the market holds above 76.55 on a daily close basis. We believe that any setbacks from here should be limited in favor of a fresh upside extension back towards 79.55 over the coming weeks. Look for a break above 78.30 to confirm and accelerate, while only a daily close below 76.55 negates and gives reason for pause.
Risk_Comeback_or_Healthy_Post_Holiday_Corrective_Rally_body_gbp2.png, Risk Comeback or Healthy Post Holiday Corrective Rally?
GBP/USD: Rallies have been very well capped ahead of 1.5800 and it looks as though a lower top has now been carved out by 1.5780 ahead of the next major downside extension back towards the October lows at 1.5270. Key support comes in by 1.5360 and a daily close below this level will be required to confirm bias and accelerate declines. Ultimately, only back above 1.5780 would negate bearish outlook and give reason for pause.
Risk_Comeback_or_Healthy_Post_Holiday_Corrective_Rally_body_swiss1.png, Risk Comeback or Healthy Post Holiday Corrective Rally?
USD/CHF: The recent break above the critical October highs at 0.9315 is significant and now opens the door for the next major upside extension over the coming weeks back towards parity. A confirmed higher low is now in place by 0.9065 following the recent break over 0.9330, and next key resistance comes in by 0.9785. Ultimately, only back under 0.9065 would delay constructive outlook.

Me and Ze 2012 Outlook & Strategy

I hope everyone had a great holiday weekend and are ready to start some serious contemplation about our investment strategy for next year. There is nothing earth shattering about this approach since I have laid the groundwork for the basic plan through regular commentary on  Yet still there is often a benefit in putting all the dots together in one place to see the full picture. That is what we will do today.
Economic Outlook
Even with the recession scare from the summer, it very much looks like the Muddle Through Economy for the US continues to stay on course. That is where we have positive GDP growth for the nation. It just never gets above the traditional 3% level we are used to relating to a healthy economy.
And yes, this is the same level of modest GDP growth that we have seen for the last two years which was good enough to keep corporate earnings on the upswing, and good enough to attract investors to stocks.
What About Europe? 
People have to separate a European slowdown from a European implosion. It appears to me, and a growing number of experts, that the Europeans have done enough to fend off the “Lehman” type implosion that would have rocked the world’s economy. Instead, they will likely go through a modest recessionary period as their nations take the austerity medicine that will make them stronger in the future.
(For more insight on my view of Europe, then http://mezecm.blogspot.com
Simply a European recession does not derail the US economy and our Muddle Through Scenario stays on track.
What About China?
No nation can grow at 8-10% forever. So there is nothing naturally ominous in the fact that their growth is slowing at this time. Too many investors are taking this as a case that China will go through a deep recession. That is possible, but not probable at this time. Especially because China has AMPLE stimulus at the ready to keep their economy going if need be.
We should continue to keep an eye on this situation because any significant decline in their ravenous demand would have negative consequences for the world economy. I just think they are more likely to grow at 3-5% in the near future versus going into a recession.
Outlook for US Stocks?
As noted above, I expect the US economy to continue to Muddle Through and that is good enough for corporate earnings growth. Right now earnings projections for the S&P 500 next year are around $106 per share. That means the market is only trading at a paltry PE of 12. Well below the historical norms of 14-15.
Now consider your alternatives. The 10 year bond only pays 2%. And shorter term cash instruments like CD’s, money markets etc pay next to nothing. Real estate is dicey at best. And the allure of gold and silver has tapered off. Add it all up and stocks remain the best game in town.
As people worry less about Europe and China then it will create a tractor beam pull towards stocks. I can easily see the market getting to 1400 on the S&P 500 which equates to a PE of just 13.2.
Why not higher if the historical norm is a PE of 14-15? Because Muddle Through Economic growth means lower than normal earnings growth and that should be accompanied by a lower than normal PE. However, if the pendulum switches from fear to greed, and bond/cash yields remain low, then touching 1500 is not out of the question.
Portfolio Strategy
Just because I am looking past Europe and China doesn’t mean the rest of the investment community is in full agreement. Nor does it guarantee that it will play out as smoothly as I might hope.
So I suspect that a lot of the volatility of the last several months will be in place for the beginning of 2012 as well. That is why I am not advocating a 100% long portfolio strategy at this time. Yet we are clearly on a path towards that posture as those dark clouds disappear.
I think the groups that will do the best in 2012 are the ones that did the worst in 2011. And those are cyclical and growth oriented groups that got pounded down when the recession fears took hold. This also means that the defensive positions that served us well in 2011 will underperform if people become less risk adverse as they are now.
Hope for the Best. Prepare for the Worst
Yes, I am putting my money where my mouth is with this forecast. But I also realize that what lies ahead may be very different from what I just described and my strategy would adjust accordingly.
Gladly I am not an investor who falls in love with their predictions and becomes paralyzed when the facts change. I stay open to all possibilities and will invest based upon the preponderance of the evidence. And thus I recommend that you do the same. In the meantime, I like the odds of more upside for stocks for all the reasons noted above. . 

Wishing You All a Happy, Healthy & Profitable New Year.

Me and Ze Capital Mnagement

Worst Case Scenario for 2012

I am not in the doom-and-gloom camp. If anything, I have a fairly positive view of the U.S. economy and the stock market in 2012. I am looking for the S&P 500 to be trading above 1400 at this time next year, which translates to a 10%-plus gain from current levels.  I expect modest earnings growth, driven by a U.S. economy that chugs along at a growth rate around 2%, while Europe avoids an implosion, and China manages a soft landing.
Having a positive view does not mean that we lose sight of the downside risks. In fact, a good appreciation of such risks should be an integral part of arriving at our outlooks.
From recession in the U.S. and/or China to the break-up of the Euro-zone, there are a number of scenarios  that will have serious implications for the market. All of these and many others can’t be just brushed aside as symptoms of paranoia; they represent real risks.
As problematic and headline-grabbing as Europe has been lately, my worst-case scenario is about China. I don’t subscribe to the view that China is one giant bubble about to burst. The Chinese economy is slowing down and my concern is that the market may be too complacent in assuming that this no more than a modest deceleration from the 10%-plus pace of the last few years to something in the 7% to 8% range. A major Chinese slowdown, something bigger than consensus expectations, is my worst-case scenario, though I would put the odds of something like that happening at less than 20%.
What is your worst-case scenario in 2012? And what do you think at the odds of that happening?

Zeshan Muhmmad Ali Awan

Dollar Faces Tough Week Ahead as Focus Turns to US Economic Data


Major Currencies vs. US Dollar (% change)
Dollar_Faces_Tough_Week_Ahead_as_Focus_Turns_to_US_Economic_Data_body_Picture_5.png, Dollar Faces Tough Week Ahead as Focus Turns to US Economic Data
Talking Points
  • Markets to Focus on US Data, Eurozone Debt Crisis in the Background
  • Signs of Improving US Outlook to Boost Risky Assets, Weigh on US Dollar
Tight correlations between most major currency pairs and the S&P 500 put broad-based market sentiment firmly in control of FX market price action (USDJPY remains an exception, with intervention fears insulating the pair from larger market themes). While the Eurozone debt crisis presents a lingering worry, the absence of scheduled event risk on this front until next week puts the spotlight on US economic data over the days ahead.
Economists’ consensus forecasts (as polled by Bloomberg) suggest GDP growth in the United States will accelerate to 2.1 percent in 2012, separating it from the other two leading engines of global output (the Eurozone and China) where performance is expected to deteriorate. This it will be up largely up to the North American behemoth to mitigate the severity of the worldwide slowdown now widely expected this year. With that in mind, the data docket appears broadly supportive: the ISM Manufacturing gauge is set to show factory-sector growth accelerated to the strongest in six months, Factory Orders are set to add the most since July, and the all-important Nonfarm Payrolls reading is forecast to reveal job creation continued to accelerate as the employment grew by 150,000.
On balance, this favors a cautious recovery in risk appetite and appears to bode ill for the safe-haven US Dollar against most of its counterparts. Needless to say, an unexpected headline reminding investors of the danger still posed by Eurozone sovereign solvency issues may upset this dynamic. Indeed, countries in the currency bloc will need to refinance a whopping €157 billion in maturing debt (likely at punitively high borrowing costs) just in the first three months of the year.
EURO
Dollar_Faces_Tough_Week_Ahead_as_Focus_Turns_to_US_Economic_Data_body_Picture_6.png, Dollar Faces Tough Week Ahead as Focus Turns to US Economic Data
Key Upcoming Events
DAY
GMT
EVENT
EXP
PREV
IMPACT
04 JAN
9:00
Euro Zone PMI Composite (DEC F)
47.9
47.9
Medium
04 JAN
10:00
Euro Zone CPI Estimate (YoY) (DEC)
2.8%
3.0%
High
06 JAN
11:00
German Factory Orders (MoM) (NOV)
-1.8%
5.2%
Medium
06 JAN
11:00
German Factory Orders (YoY) (NOV)
-1.2%
5.4%
Medium
BRITISH POUND
Dollar_Faces_Tough_Week_Ahead_as_Focus_Turns_to_US_Economic_Data_body_Picture_7.png, Dollar Faces Tough Week Ahead as Focus Turns to US Economic Data
Key Upcoming Events
DAY
GMT
EVENT
EXP
PREV
IMPACT
04 JAN
09:30
Mortgage Approvals (NOV)
52.5K
52.7K
Medium
05 JAN
09:30
PMI Services (DEC)
51.5
52.1
Medium
JAPANESE YEN
Dollar_Faces_Tough_Week_Ahead_as_Focus_Turns_to_US_Economic_Data_body_Picture_8.png, Dollar Faces Tough Week Ahead as Focus Turns to US Economic Data
Key Upcoming Events
DAY
GMT
EVENT
EXP
PREV
IMPACT
05 JAN
5:00
Vehicle Sales (YoY) (DEC)
-
24.1%
Medium
CANADIAN DOLLAR
Dollar_Faces_Tough_Week_Ahead_as_Focus_Turns_to_US_Economic_Data_body_Picture_9.png, Dollar Faces Tough Week Ahead as Focus Turns to US Economic Data
Key Upcoming Events
DAY
GMT
EVENT
EXP
PREV
IMPACT
05 JAN
15:00
Ivey Purchasing Managers Index (DEC)
54.8
59.9
Medium
06 JAN
12:00
Net Employment Change (DEC)
17.5K
-18.6K
High
06 JAN
12:00
Unemployment Rate (DEC)
7.4%
7.4%
High
AUSTRALIAN DOLLAR
Dollar_Faces_Tough_Week_Ahead_as_Focus_Turns_to_US_Economic_Data_body_Picture_10.png, Dollar Faces Tough Week Ahead as Focus Turns to US Economic Data
Key Upcoming Events
DAY
GMT
EVENT
EXP
PREV
IMPACT
04 JAN
22:30
AiG Performance of Service Index (DEC)
-
47.7
Medium
05 JAN
00:30
Trade Balance (A$) (NOV)
1650M
1595M
Medium
NEW ZEALAND DOLLAR
Dollar_Faces_Tough_Week_Ahead_as_Focus_Turns_to_US_Economic_Data_body_Picture_11.png, Dollar Faces Tough Week Ahead as Focus Turns to US Economic Data

How to Avoid Taking Profits Too Quickly and Staying with Losing Trades Too Long

Does this sound familiar…
“Most of the time I earn a few pips and close out the trade because I want to catch it while it is still profitable. But when the trades goes against me I will hang onto it too long thinking it will come back to profitability but I get scared and close it out so I end up losing more. And then, what’s really frustrating is that the trade ends up moving in the direction of my original trade. How can I learn to ‘stick with my trade’ ?”
This is a great question and it is something that all traders, especially in the beginning, have a challenge with. It is also something that is gained through experience.
A key thing that a trader must do is acknowledge that you will have losing trades. If a trade moves against you, as a trader you need to be willing to accept that loss just as you are willing to accept the winning trades. Since you are trading with risk capital, money that you can afford to lose, a trader must be OK with that loss as it will not affect their life style one tiny bit. Losses are simply a part of trading.
(If you are not trading with risk capital, stop trading!)
Once a trader accepts that concept, they will be more inclined to let a trade “play out” and not jump at the chance to lock in a tiny bit of profit or become distraught as a trade begins to move against them and close out the position.
Next, be certain that you are taking only the higher probability trades, those that are in the direction of the trend, and that your entries are based on a solid technical reason such as a break of support or resistance. When a trader knows that they are trading a pair that is in a strong trend, they will have the courage of their conviction to be able to “stick with the trade” as it is in a strong trend. (This does not mean that sticking with a trade in the direction of the trend will insure a winning trade. It does mean, however, that you will be taking trades that have a greater potential for success.)
Once you have decided on the higher probability pair you will trade and know where you will place your initial stop and limit, when the trade executes…leave it alone! Promise yourself that you will only let the trade limit out or be stopped out.
Lastly, be sure that you are following the principles of Money Management. So when the losing trades occur, your losses will be small and manageable.
Practice this discipline many, many times in a Demo account until you become comfortable with it.