Zeshan Muhammad Ali Awan
(Director Technicals Me & Ze Capital management)
Long USDJPY: Safety, Manipulation and Yield
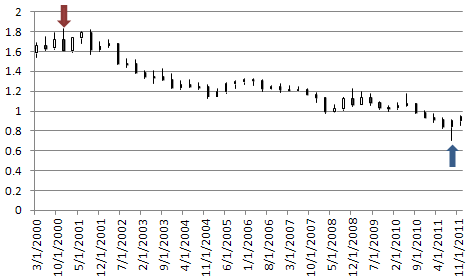
My call for a drive higher from USDJPY has, admittedly, been a consistent belief of mine for much of this past year. And yet, the pair has forged little progress to make that a reality. As they say, patience is a virtue. My trading approach is to combine rudimentary technicals and capital flow-based fundamentals; and both of these legs of analysis lead me to the same bullish conclusion for the foreseeable future: an advance for USDJPY. The first consideration is the pair incredible proximity to its record low. Extending historical extremes is exceptionally difficult. So, we need a catalyst for reversal. Short-term, we have the threat of manipulation from the BoJ and Ministry of Finance to offer economic relief. Medium-term, we have the possibility of a deepening financial rut that makes us more selective of safe havens (the dollar is undisputed for relative liquidity, credit market stability). And, long-term, the return of higher global rates supports the Fed moving while the BoJ continues a two-decade, near-ZIRP policy regime. The question of timing the entry is my biggest hang up; but starting small and building up with confirmation is a good strategy for me.
Long CADJPY: The Return of the Carry Trade
It’s inevitable that all we can think of heading into the New Year is the threat of the global financial crisis and another world-wide recession because uncertainty is immediate and there is still considerable long-risk exposure out there that needs to be unwound. However, if we look beyond the next shock, we will likely find that a lot of the leverage will have been worked down and idle capital will need to be reinvested. There will be a significant level of high-speculative investments; but the bulk of funds will be put behind lower risk investments – namely carry trade. Rates and rate differentials are already low; and they will be lower by the time underlying conditions turn around. A pair like AUDJPY will immediately have an advantage as its yield spread will likely be higher at the turn; but a lot of the capital appreciation that occurs in the exchange rate lies with the rate hikes (and expectations of those hikes). That puts CADJPY is a very good position as the Canadian dollar’s rate is already low. What’s more, there is an investment quality to the ‘loonie’ due to its commodity infrastructure and guaranteed export demand to China and the US.
Sarah Abbas Gondal
(Managing Director Me & Ze Capital management)
Long USDJPY
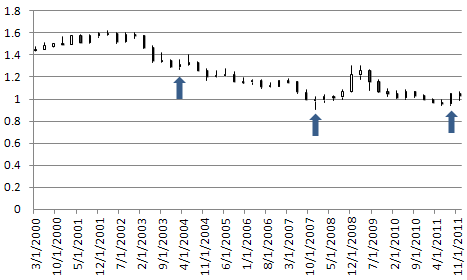
I would hate to think that the DailyFX analyst boat is getting pretty crowded with calls for a major reversal in the USDJPY. Yet I think there are many reasons why we might expect a significant USDJPY bounce, and the change in year is not the least of reasons the USDJPY might switch direction.
Instead of going long blindly into 2012, however, I’d like to see how we start off.
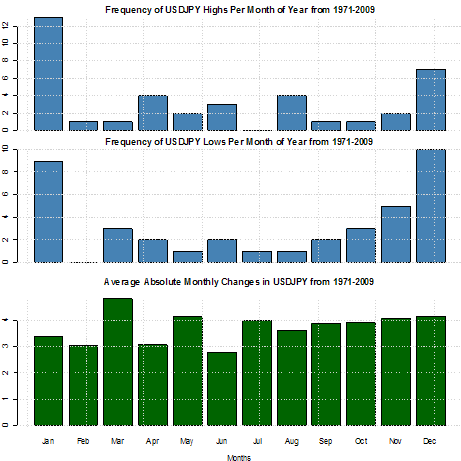
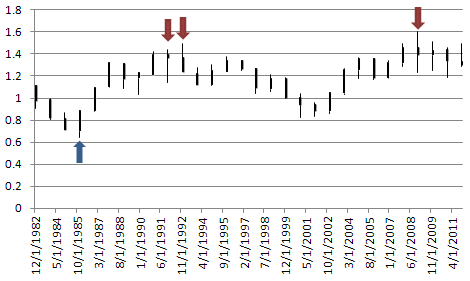
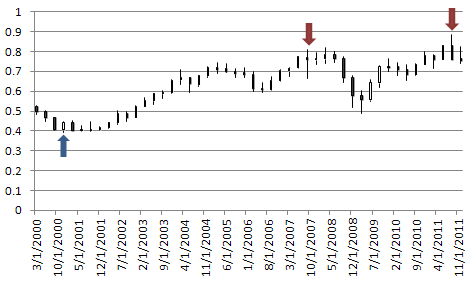
The above shows nearly 40 years of data in the USDJPY and the propensity for the pair to make its highs and lows for the year in the months of January and December. If we expected price to be completely random, there would be equal instances in which the highs/lows for the year were set for each month. Yet there were 9 instances in which the pair made its low for the year in USDJPY—nearly 25% of all years.
How might we look to trade this? With a long-term swing trade. If we see that the USDJPY respects 2011 lows in January, we could set orders to buy a break of January highs and set a stop below January lows. The limits would be set as conditions dictate. Yet we would have seasonality on our side, and having a central bank intent on keeping the USDJPY above record lows doesn’t hurt either.
Samera Mistry
(Director Business Development Me & Ze Capital Management)
Short AUDUSD and Short NZDUSD: Strong Evidence of Long Term Reversals
A scan of yearly and quarterly charts reveals reversal opportunities in the USDCHF (yearly and quarterly), AUDUSD (quarterly), NZDUSD (quarterly), and USDCAD (quarterly). I define a reversal with yearly data as a new 5 year high/low, a close above/below the prior year’s close, and a range for the year that is at least as large as the average range for the last 5 years. A reversal with quarterly data uses 12 periods (3 years) (for monthly 12, for weekly 13, and for daily 20). No method is immune to false signals, but key reversals indicate favorable reward/risk opportunities because a potentially significant pivot (high or low) is identified with minimal lag (when viewed in the context of the time frame being analyzed).
Many decade long turns have been indicated by yearly or even quarterly key reversals. The study also highlights the tendency for exchange rates to reverse during high volatility environments (hint – USDJPY volatility is NOT high which decreases the probability that an important low is in place).
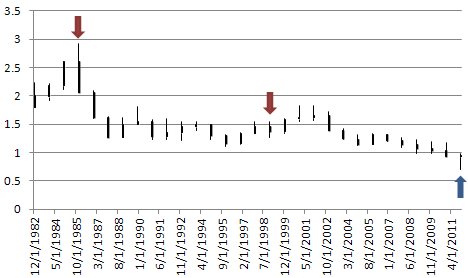
AUDUSD QUARTERLY CANDLES (since 2000)
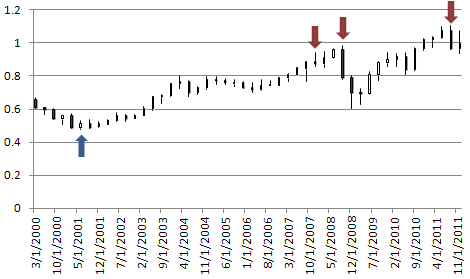
A bullish reversal occurred in the 2nd quarter of 2001. Bearish reversals occurred in the 4th quarter of 2007 and the 3rd quarter of 2008. The 2007 reversal didn’t pan out. Price fell another 1900 pips (to the low) after the 2008 reversal (close to close was 897 pips). The most recent reversal occurred during the 3rd quarter of 2011.
NZDUSD QUARTERLY CANDLES (since 2000)
A bullish reversal occurred in the 4th quarter of 2000. Bearish reversals occurred in the 3rd quarter of 2007 and the 3rd quarter of 2011. The 2007 reversal didn’t pan out immediately as the actual high was not until the 1st quarter of 2008.
The most recent large degree reversals paint a picture of USD strength in 2012. Unless your holding period is a year or more (Ilya), I do not suggest treating these reversals as signals. Rather, understand that conditions for the pairs examined are consistent with previous long term reversals. This knowledge should help in constructing favorable reward/risk opportunities in 2012.
Mehak Awan
(Director Sales and marketing Me & Ze Capital Management)
Short EURUSD: The Multi-Year Euro Downtrend Continues
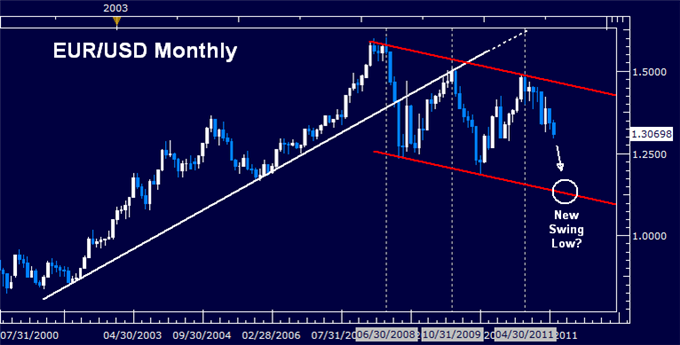
Broadly speaking, the Euro has been trending lower since July 2008 having peaked above 1.60 against the US Dollar. More of the same seems almost certainly ahead. The Eurozone debt crisis remains unresolved, presenting a two-pronged problem. On one hand, it amplifies already considerable headwinds facing economic growth. Soaring borrowing costs amid fears of a default within the currency bloc stymie activity as individuals and businesses find it more expensive to spend and invest. In turn, slower growth reduces regional governments’ tax intake, making it harder to reduce deficits, stoking already considerable sovereign solvency fears and producing a vicious cycle. Economists’ consensus forecasts suggest growth in the Euro Zone will stall in 2012 and recovery only modestly in the following year. Meanwhile, growth in the US is expected to accelerate over the same period. This beckons aggressive monetary stimulus from the ECB, suggesting interest rate differentials will narrow firmly in favor of the US Dollar even if the Federal Reserve opts to make good on its promise to keep benchmark borrowing costs on hold through mid-2013.
On the other hand, it threatens to unleash another market-wide selloff and global credit crunch, plunging worldwide finance into another existential crisis just three years after the 2008 debacle. In the event of a default in a large country like Italy or Spain countless banks, funds and other institutions would be forced to book sharp losses. For some, taking such a hit will prove unbearable and they will be forced to go out of business, sending ripple effects across the markets as their creditors now face losses, and so forth. Those that remain standing will rush to raise new capital, with banks and funds dumping assets at fire-sale prices to meet reserve and margin requirements. This translates into another broad-based rout across asset classes, erasing incalculable amounts of firms’ and individuals’ wealth. It goes without saying that such an outcome would outright crush private-sector economic activity on a global scale. Needless to say, such an outcome bodes very well for safe-haven currencies and in particular for the US Dollar, where official intervention does not undermine its store-of-value properties (as is the case with the Japanese Yen and Swiss Franc, typically the other go-to safety vehicles in the FX space).
Zeshan Muhammad Ali Awan
Foreign Investment in US Equities
While on the surface, the recommendation appears to be non-currency specific, we view this as an extremely attractive opportunity for a portfolio hedge in 2012 and potential arbitrage strategy. Currencies have been broadly outperforming against the US Dollar in recent years and it finally appears as though this trend could be on the verge of some form of a reversal back in favor of the buck. However, long USD positions have also been quite risky and exposure to the Greenback might bring with it some unwelcome stress. As such, our recommendation for non-US residents is to instead, put their money into US equities. What does this mean?
Here is how we see this playing out. Should current correlations stand, if US equities are to head higher, then the investor will benefit from the US equity return, but at the same time, likely have his/her investment offset by the sell-off in the US Dollar and appreciation in his/her local currency on the resurgence in risk appetite and outflow from the safe-haven US Dollar. If on the other hand US equities head lower, then the risk off market environment will allow the investor to offset his/her loss in US stocks through the appreciation in the US Dollar on its safe-haven flows (remember – the investor in invested in US equities and thereby has USD exposure).
So if this is the case, then where is the benefit in this trade, and why even do it? Well, what if we see a break down in familiar correlations where the US equity market rallies and the US Dollar also rallies at the same time? What if we see a situation where US equities and the US Dollar become positively correlated? In this scenario, the investor stands to benefit a great deal and will not only make money from his investment in US equities, but will also enhance his/her returns on the appreciation in the US Dollar.
The global recession appears to be moving in phases, and with the markets now dealing with phase two of the crisis in Europe, we can start to anticipate the transition to phase three, where we believe that China, the commodity bloc economies and emerging markets will all be exposed. At the same time, we see a first in and first out type of situation, with the US economy the first to emerge from the global recession which should translate into a more upbeat outlook on low valuation US equities and the US Dollar as well, on a narrowing of yield differentials back in favor of the Greenback as the Fed begins to signal a reversal of ultra accommodative monetary policy.
Sarah Abbas Gondal
Short EURGBP: U.K. Remains Ahead Of the Curve
As European policy makers struggle to address the sovereign debt crisis, we expect the single currency to face additional headwinds in 2012. Although the EUR/USD will be the center of attention for most FX traders, I will be keeping a close eye on the EUR/GBP.
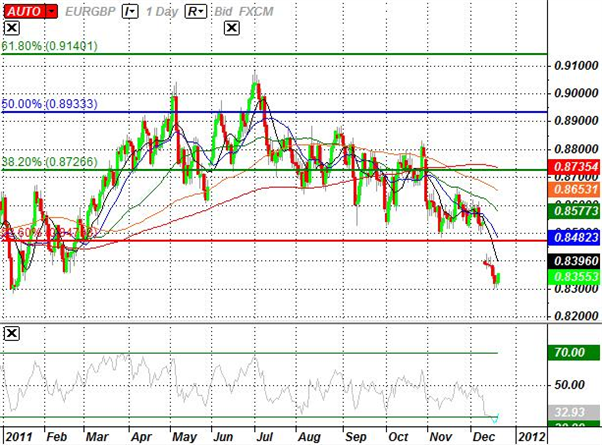
After actively trading the euro-pound throughout 2011, the British Pound has recent strengthened against its European counterpart, and the sterling should continue to outpace the single currency in the following year as the U.K. government remains ahead of the curve in balancing their public finances. As the euro-area faces an increased threat of a credit-rating downgrade, we expect the heightening risk for contagion to drag on the Euro, and the exchange rate should continue to push lower in the following year as the EU fails to restore investor confidence. However, as the fundamental outlook for the U.K. and Euro-Zone remains clouded with high uncertainty, monetary policy will be a key driver of price action for the EUR/GBP.
As the European Central Bank and the Bank of England carry their easing cycle into 2012, we expect to see additional monetary support in 2012, but the preemptive approach taken by the BoE should help to increase the appeal of the sterling. At the same time, with record-low rates in the U.K., we may see market participants move away from the Euro and into the British Pound should we see the flight to safety gather pace.
Sarah Abbas Gondal
Short AUDUSD: Risks to Global Growth, China
We have all witnessed the extreme volatility and resulting shocks to markets the crisis in Europe has ignited over the past year. Mainly, this is due to the debt contagion fears spread rapidly not only across the region, but also across the world’s most developed economies. Considering the magnitude of the EU crisis, it comes as no surprise that an ominous cloud has gone relatively unnoticed under the radar: China. As the Chinese government struggles to achieve a “soft landing” from the extraordinary measures taken at the height of the financial crisis, the economy continues to show signs of stress as growth in one of the world’s fastest growing economies begins to slow. China’s trade surplus has continued to shrink as a housing bubble appears to be ready to burst while current fears of a credit crunch have fueled concerns of a substantial slowdown in growth. As Australia’s top trade partner, a slowdown in China is likely to put pressure on the aussie as decreased demand for Australian exports weighs on the isle-nation’s economy.
In addition to the China story, the Reserve Bank of Australia is also likely to aggressively cut rates in 2012 with Credit Suisse overnight swaps now factoring in more than 116 basis points in interest rate cuts for the next twelve months, the highest expectations for cuts among the developed economies. In spite of two rate cuts towards the tail end of 2011, increased concerns over the debt crisis in Europe and expectations for further weakness in global trade will continue to put pressure on RBA Governor Glenn Stevens to soften monetary policy and maintain an accommodative environment for businesses.
AUDUSD Daily
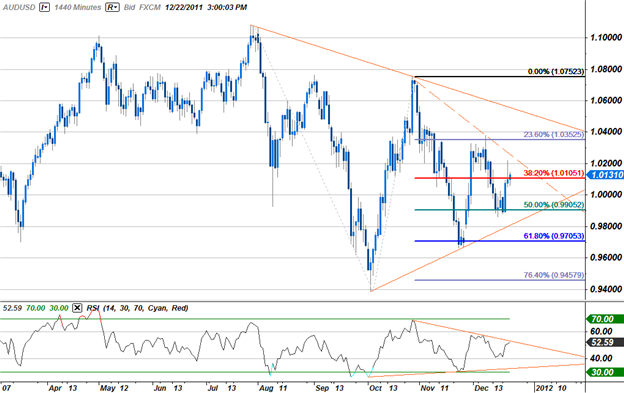
The AUD/USD has been in consolidation since the June 27th high at 1.1079, with the pair continuing to hold within the confines of a wedge formation for the past 5 months. A Fibonacci extension taken from the June and October highs reveal clear resistance at the 23.6% extension at 1.0350 followed by the upper bound trendline of the wedge formation. Our bias will remain intact so long as this level is not compromised, with a breach above eyeing targets at 1.0750, and the 1.01-figure. Support targets are held at the 50% extension at the 99-handle, with a break here exposing targets at trendline support dating back to the October 4th lows and the 61.8% extension at the 0.97-handle. This level will remain paramount for the aussie with a break below risking substantial losses for the high yielder as it looks to test the 2011 lows at the 0.94-figure.
Samera Mistry
Swiss Franc to Underperform in 2012
Long EURCHF and USDCHF: What’s going on Across the Pond besides the Debt Crisis?
While the Euro-zone faces a recession even if it is able to climb the wall of worry and convince market participants that none of its member countries will default on their debt, other European nations are facing stress. The one of greatest interest, in my opinion, is Switzerland.
To put the Swiss economy in perspective, one needs to look no further than how the Swiss Franc performed from the start of 2011 until early August. The EUR/CHF opened the year at 1.2500, and as the United States’ debt deadline approached, coupled with the Euro-zone debt crisis, the EUR/CHF quickly approached parity. Recent data showed that Swiss growth in the third quarter had stumbled to a meager 0.2 percent rate on a quarterly basis, or 1.5 percent year-over-year. By September, Inflation was at a paltry 0.2 percent yearly rate, well-below the Swiss National Bank threshold.
The combination of these downside pressures on the Swiss economy – slowing growth, slower inflation, capital flight to the Swiss Franc which damaged the export sector – forced the SNB to place a 1.2000 floor in the EUR/CHF on September 6. Recent speculation suggests that the floor might be raised to 1.2500 or 1.3000 in the coming weeks now that the SNB can’t legally implement negative interest rates to deter Franc appeal. The SNB will be forced to act, regardless of what is transpiring in the Euro-zone.
Given the fundamental backdrop of Switzerland, it appears that the Franc will lose value over the course of 2012. In regards to the debt crisis itself, the European Central Bank may ultimately be forced to print money to help the periphery nations. This has implications for the Franc.
If the ECB chooses not to explicitly print money, the sovereign debt crisis is likely to get worse before it gets better, and investors will lose confidence in the future of the Euro-zone, and thus the Euro, fleeing to the Franc. This downside pressure on the EUR/CHF will force the SNB’s hand. Conversely, if the ECB does print money, the Euro will likely lose value, much like what the U.S. Dollar did after the Federal Reserve decided to inject the financial system with more U.S. Dollars; this too will put pressure on EUR/CHF. Both outcomes point towards a weaker Euro, and thus a weaker EUR/CHF (the third scenario, in which joint Eurobonds are issued, is off the table for now as Germany continues to oppose such an idea).
The deterioration of the Euro-zone coupled with the likelihood of the ECB printing money at some point in the coming months suggests that there will be increased downside pressure on the EUR/CHF, and thus, on the SNB to hold the 1.2000 floor. To head off these pressures, the SNB might preemptively raise the EUR/CHF floor to 1.2500 or 1.3000 in the coming months. Major banks have suggested that the floor could rise as high as 1.4000.
Even in the most bullish of scenarios, the outlook for the Franc remains weak. If the Euro-zone avoids a recession or collapse, the Swiss economy is primed to be dragged into a recession of its own, and the SNB will act accordingly. As such, promising trades in 2012 look long EUR/CHF and USD/CHF.