Why Do Traders Lose?If you've been trading for a long time, you no doubt have felt that a monstrous, invisible hand sometimes reaches into your trading account and takes out money. It doesn't seem to matter how many books you buy, how many seminars you attend or how many hours you spend analyzing price charts, you just can't seem to prevent that invisible hand from depleting your trading account funds.
Which brings us to the question: Why do traders lose? Or maybe we should ask, "How do you stop the Hand?" Whether you are a seasoned professional or just thinking about opening your first trading account, the ability to stop the Hand is proportional to how well you understand and overcome the Five Fatal Flaws of trading. For each fatal flaw represents a finger on the invisible hand that wreaks havoc with your trading account.
Fatal Flaw No. 1 -- Lack of Methodology
If you aim to be a consistently successful trader, then you must have a defined trading methodology, which is simply a clear and concise way of looking at markets. Guessing or going by gut instinct won't work over the long run. If you don't have a defined trading methodology, then you don't have a way to know what constitutes a buy or sell signal. Moreover, you can't even consistently correctly identify the trend.
How to overcome this fatal flaw? Answer: Write down your methodology. Define in writing what your analytical tools are and, more importantly, how you use them. It doesn't matter whether you use the Wave Principle, Point and Figure charts, Stochastics, RSI or a combination of all of the above. What does matter is that you actually take the effort to define it (i.e., what constitutes a buy, a sell, your trailing stop and instructions on exiting a position). And the best hint I can give you regarding developing a defined trading methodology is this: If you can't fit it on the back of a business card, it's probably too complicated.
Fatal Flaw No. 2 -- Lack of Discipline
When you have clearly outlined and identified your trading methodology, then you must have the discipline to follow your system. A Lack of Discipline in this regard is the second fatal flaw. If the way you view a price chart or evaluate a potential trade setup is different from how you did it a month ago, then you have either not identified your methodology or you lack the discipline to follow the methodology you have identified. The formula for success is to consistently apply a proven methodology. So the best advice I can give you to overcome a lack of discipline is to define a trading methodology that works best for you and follow it religiously.
Fatal Flaw No. 3 -- Unrealistic Expectations
Between you and me, nothing makes me angrier than those commercials that say something like, "...$5,000 properly positioned in Natural Gas can give you returns of over $40,000..." Advertisements like this are a disservice to the financial industry as a whole and end up costing uneducated investors a lot more than $5,000. In addition, they help to create the third fatal flaw: Unrealistic Expectations.
Yes, it is possible to experience above-average returns trading your own account. However, it's difficult to do it without taking on above-average risk. So what is a realistic return to shoot for in your first year as a trader -- 50%, 100%, 200%? Whoa, let's rein in those unrealistic expectations. In my opinion, the goal for every trader their first year out should be not to lose money. In other words, shoot for a 0% return your first year. If you can manage that, then in year two, try to beat the Dow or the S&P. These goals may not be flashy but they are realistic, and if you can learn to live with them -- and achieve them -- you will fend off the Hand.
Fatal Flaw No. 4 -- Lack of Patience
The fourth finger of the invisible hand that robs your trading account is Lack of Patience. I forget where, but I once read that markets trend only 20% of the time, and, from my experience, I would say that this is an accurate statement. So think about it, the other 80% of the time the markets are not trending in one clear direction.
That may explain why I believe that for any given time frame, there are only two or three really good trading opportunities. For example, if you're a long-term trader, there are typically only two or three compelling tradable moves in a market during any given year. Similarly, if you are a short-term trader, there are only two or three high-quality trade setups in a given week.
All too often, because trading is inherently exciting (and anything involving money usually is exciting), it's easy to feel like you're missing the party if you don't trade a lot. As a result, you start taking trade setups of lesser and lesser quality and begin to over-trade.
How do you overcome this lack of patience? The advice I have found to be most valuable is to remind yourself that every week, there is another trade-of-the-year. In other words, don't worry about missing an opportunity today, because there will be another one tomorrow, next week and next month...I promise.
I remember a line from a movie (either Sergeant York with Gary Cooper or The Patriot with Mel Gibson) in which one character gives advice to another on how to shoot a rifle: "Aim small, miss small." I offer the same advice in this new context. To aim small requires patience. So be patient, and you'll miss small.
Fatal Flaw No. 5 -- Lack of Money Management
The final fatal flaw to overcome as a trader is a Lack of Money Management, and this topic deserves more than just a few paragraphs, because money management encompasses risk/reward analysis, probability of success and failure, protective stops and so much more. Even so, I would like to address the subject of money management with a focus on risk as a function of portfolio size.
Now the big boys (i.e., the professional traders) tend to limit their risk on any given position to 1% - 3% of their portfolio. If we apply this rule to ourselves, then for every $5,000 we have in our trading account, we can risk only $50 - $150 on any given trade. Stocks might be a little different, but a $50 stop in Corn, which is one point, is simply too tight a stop, especially when the 10-day average trading range in Corn recently has been more than 10 points. A more plausible stop might be five points or 10, in which case, depending on what percentage of your total portfolio you want to risk, you would need an account size between $15,000 and $50,000.
Simply put, I believe that many traders begin to trade either under-funded or without sufficient capital in their trading account to trade the markets they choose to trade. And that doesn't even address the size that they trade (i.e., multiple contracts).
To overcome this fatal flaw, let me expand on the logic from the "aim small, miss small" movie line. If you have a small trading account, then trade small. You can accomplish this by trading fewer contracts, or trading e-mini contracts or even stocks. Bottom line, on your way to becoming a consistently successful trader, you must realize that one key is longevity. If your risk on any given position is relatively small, then you can weather the rough spots. Conversely, if you risk 25% of your portfolio on each trade, after four consecutive losers, you're out all together.
Break the Hand's Grip
Trading successfully is not easy. It's hard work...damn hard. And if anyone leads you to believe otherwise, run the other way, and fast. But this hard work can be rewarding, above-average gains are possible and the sense of satisfaction one feels after a few nice trades is absolutely priceless. To get to that point, though, you must first break the fingers of the Hand that is holding you back and stealing money from your trading account. I can guarantee that if you attend to the five fatal flaws I've outlined, you won't be caught red-handed stealing from your own account.
Friday, 30 December 2011
Five Fatal Flaws of Trading By Me andZe Capital Management
US Dollar Should Be Across the Board Outperformer in 2012 Expect The Biggest Rally
- Euro set for yearly close below 1.3000
- Looking for additional Euro declines towards 1.2000 in 2012
- US Dollar see as most attractive currency in 2012
- Australian Dollar could be even more exposed then Euro going forward
- Third phase of global crisis expected to hit China
The Euro looks poised to
close out the year below 1.3000 after dropping to a fresh 2011 low by
1.2858 on Thursday. The bearish close is rather appropriate in the grand
scheme of things considering the Eurozone crisis was at the center of
all things troubled in 2011. From here, we would expect to see Euro
declines accelerate into 2012, particularly against the US Dollar, with a
measured move objective coming in somewhere near the 1.2000 area.
Broadly speaking, we anticipate across the board US Dollar bids against
all major and minor currencies, with the US Dollar seen as the most
attractive currency in 2012 on both its safe haven appeal and the
prospects for a sustained economic recovery in the United States.
We also project relative
underperformance even against the Euro in the China correlated commodity
bloc and emerging market currencies, on the expectation that a third
phase of the global recession will soon fully reveal itself in China
into 2012. We think this will be the next big shoe to drop, and we
therefore warn against long positions, specifically in the Australian
Dollar which we contend is highly overvalued and quite exposed at
current levels.
Looking Ahead to 2012 - Foreign Investment in US Equities
While on the surface, the
recommendation appears to be non-currency specific, we view this as an
extremely attractive opportunity for a portfolio hedge in 2012 and
potential arbitrage strategy. Currencies have been broadly outperforming
against the US Dollar in recent years and it finally appears as though
this trend could be on the verge of some form of a reversal back in
favor of the buck. However, long USD positions have also been quite
risky and exposure to the Greenback might bring with it some unwelcome
stress. As such, our recommendation is foreign investment in US equities. What does this mean?
Here is how we see this
playing out. Should current correlations stand, if US equities are to
head higher, then the investor will benefit from the US equity return,
but at the same time, likely have his/her investment offset by the
sell-off in the US Dollar and appreciation in his/her local currency on
the resurgence in risk appetite and outflow from the safe-haven US
Dollar. If on the other hand US equities head lower, then the risk off
market environment will allow the investor to offset his/her loss in US
stocks through the appreciation in the US Dollar on its safe-haven flows
(remember – the investor in invested in US equities and thereby has USD
exposure).
So if this is the case, then
where is the benefit in this trade, and why even do it? Well, what if
we see a break down in familiar correlations where the US equity market
rallies and the US Dollar also rallies at the same time? What if we see a
situation where US equities and the US Dollar become positively
correlated? In this scenario, the investor stands to benefit a great
deal and will not only make money from his investment in US equities,
but will also enhance his/her returns on the appreciation in the US
Dollar.
The global recession appears
to be moving in phases, and with the markets now dealing with phase two
of the crisis in Europe, we can start to anticipate the transition to
phase three, where we believe that China, the commodity bloc economies
and emerging markets will all be exposed. At the same time, we see a
first in and first out type of situation, with the US economy the first
to emerge from the global recession which should translate into a more
upbeat outlook on low valuation US equities and the US Dollar as well,
on a narrowing of yield differentials back in favor of the Greenback as
the Fed begins to signal a reversal of ultra accommodative monetary
policy.
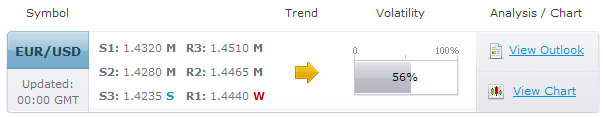
TECHNICAL OUTLOOK
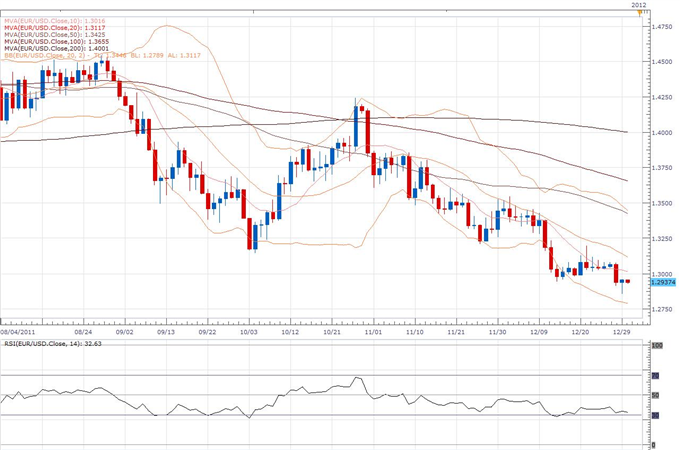
EUR/USD:
The market is now looking to establish below the critical 2011 lows
from January 2011 at 1.2870 and a weekly close below this level will
open the door for the next major downside extension towards the 1.2500
area. Overall, we retain a strong bearish outlook for this market and
look for setbacks to extend towards the 1.2000 handle over the coming
months. While we would not rule out the potential for corrective
rallies, any rallies should be very well capped above 1.3500.
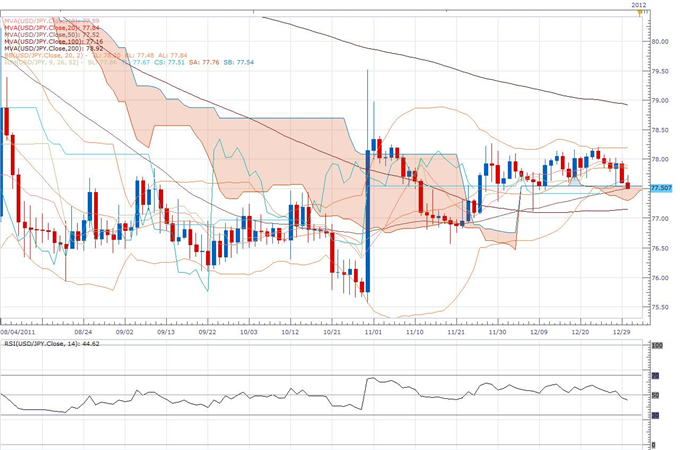
USD/JPY:The
market has managed to successfully hold above the bottom of the daily
Ichimoku cloud to further strengthen our constructive outlook and we
look for the formation of a inter-day higher low by 76.55 ahead of the
next major upside extension back towards and eventually through the
recent multi-day highs by 79.55. Ultimately, only a close back below the
bottom of the Ichimoku cloud would negate outlook and give reason for
pause, while a daily close back above 78.30 accelerates.
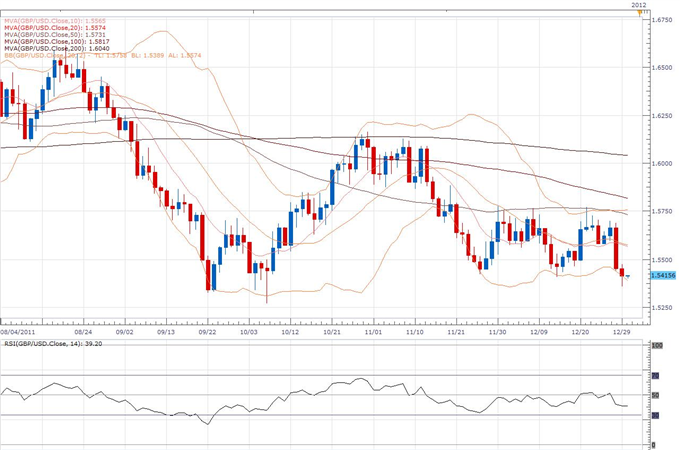
GBP/USD:
Rallies have been very well capped ahead of 1.5800 and it looks as
though a lower top has now been carved out by 1.5780 ahead of the next
major downside extension back towards the October lows at 1.5270. Key
support comes in by 1.5400 and a daily close below this level will be
required to confirm bias and accelerate declines. Ultimately, only back
above 1.5780 would negate bearish outlook and give reason for pause.
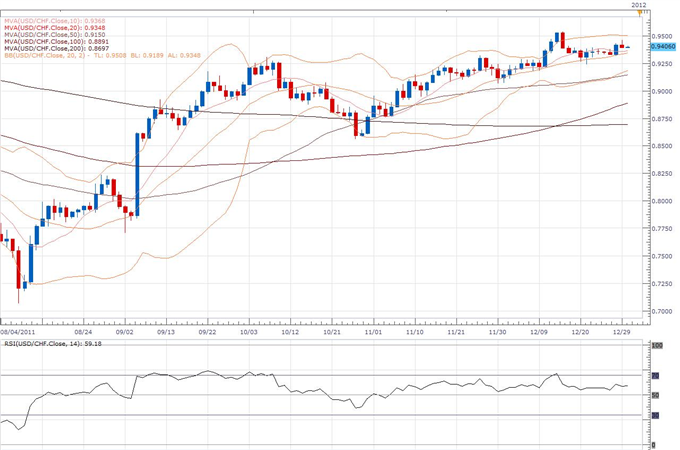
USD/CHF:
The recent break above the critical October highs at 0.9315 is
significant and now opens the door for the next major upside extension
over the coming weeks back towards parity. A confirmed higher low is now
in place by 0.9065 following the recent break over 0.9330, and next key
resistance comes in by 0.9785. Ultimately, only back under 0.9065 would
delay constructive outlook.
Written by Zeshan Muhammad Ali Awan
Technical Currency Strategist
Euro US Dollar Exchange Rate Forecast
Euro/US Dollar Technical Forecast
Monthly Chart
Prepared by Sarah Abbas
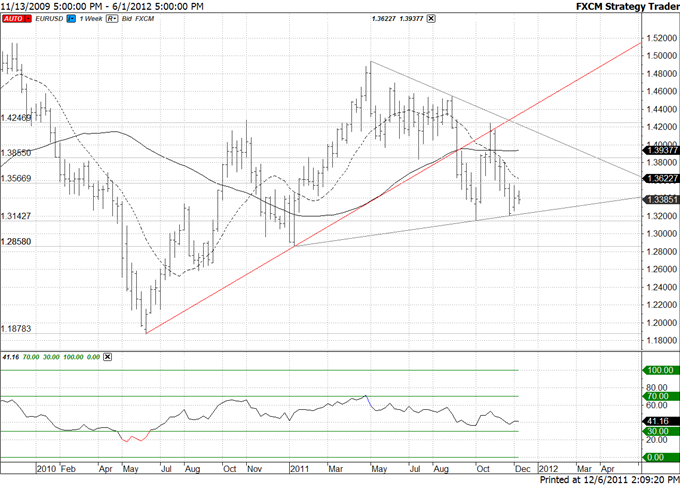
While a head and shoulders top may be forming from
the November 2010 top, don’t be surprised to see the EURUSD hold up for
at least another month. Recent COT data shows that commercials are long a
record number of contracts and non commercials (large speculators) are
nearly as short as they were at the 2010 bottom. One would expect
positioning to moderate before a true breakdown occurs. Resistance this month is 13565 and 13855. The obvious 13150 is support with a break exposing 12850 (January and 2011 low).
Euro / US Dollar Interest Rate Forecast
|
Currency, Central Bank
|
Euro,European Central Bank
|
US Dollar, US Federal Reserve
|
Net EURUSD Spread
|
Signal
|
|
1-Year Expectations(Basis Points)
|
(22)
|
5
|
(27)
|
Bearish
|
|
Yield in 1 Year(Percent)
|
1.03
|
0.30
|
0.73
|
Bullish
|
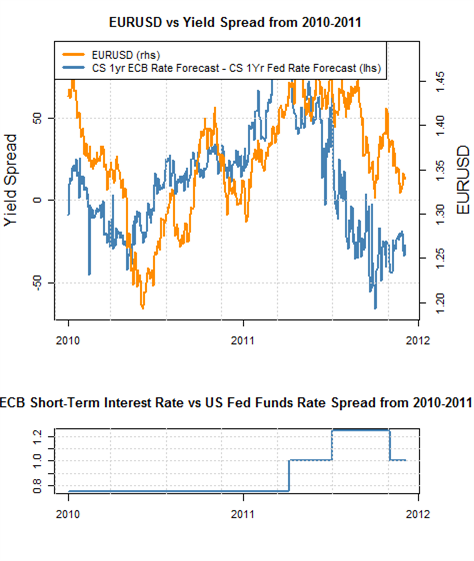
Euro/US Dollar Interest Rate Trading Bias: Neutral
Analysts predict that the
European Central Bank will cut interest rates by a modest 22 basis
points in the coming 12 months, while the US Federal Reserve will leave
interest rates unchanged. Relatively neutral yield expectations give
little reason to call for significant EURUSD declines. Yet to focus on
interest rates alone misses the real driver of recent EURUSD volatility:
European fiscal crises.
It seems as though European
governments are on the cusp of announcing the next significant
breakthrough in fiscal bailouts. Yet we’ve all heard this story before,
and the real truth is that substantial changes remain difficult.
We remain overall bearish the Euro against the US Dollar from a fundamental standpoint. Yet shorter-term sentiment analysis suggests that the EURUSD could rally through December before falling further in the New Year.
Euro / US Dollar Valuation Forecast
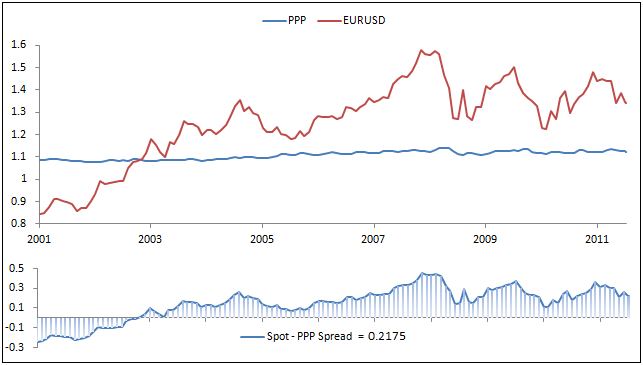
EURUSD Valuation Forecast: Bearish
Source: Me and Ze Capital Management
The Euro
remains significantly overvalued against the US Dollar, trading 2175
pips or 16.23 percent above its PPP-implied fair exchange rate. The
greenback’s primacy as a safe haven as investors turn away the
intervention-hindered Japanese Yen and Swiss Franc calls for a deeper
correction of the value gap ahead as the Eurozone debt crisis continues
to weigh on market-wide risk appetite. Importantly, even if the currency
bloc’s policymakers finally craft a functional scheme to relieve
sovereign stress – most likely along the lines of an idea floated by
newly-minted ECB President Mario Draghi that proposes following a
credible plan for deeper fiscal integration with an expanded bond-buying
program from the central bank to reign in borrowing costs – the Euro is
likely to suffer nonetheless. Indeed, austerity measures are weighing
heavily on growth, meaning the ECB is likely to continue cutting
interest rates. Any QE-style program that emerges as part of the debt
crisis relief deal would naturally reinforce this trajectory.
What is Purchasing Power Parity?
One of the
oldest and most basic fundamental approaches to determining the “fair”
exchange rate of one currency to another relies on the concept of
Purchasing Power Parity. This approach says that an identical product
should cost the same from one country to another, with the only
difference in the price tag accounted for by the exchange rate. For
example, if a pencil costs €1 in Europe and $1.20 in the US, the “fair”
EURUSD exchange rate should be 1.20. For our purposes, we will use the
PPP values provided annually by Bloomberg. We compare these values to
current market rates to determine how much each currency is under- or
over-valued against the US DollarThe Professional Trader’s Friend: Trends | FXCM Expo 2011 | FXCM Expo
The Professional Trader’s Friend: Trends | FXCM Expo 2011 | FXCM Expo
Sponsored By Me and Ze Capital Management
Sponsored By Me and Ze Capital Management
Gold Respects Resistance - Sell Off Coming...
Gold Respects Resistance - Sell Off Coming?
Gold has been technically and fundamentally supported for several years. The technical patterns are beginning to break down which could mean the shiny metal has the potential to sell off from current levels.
A break below 1532 would confirm a new downtrend and offer a trader an entry to sell.
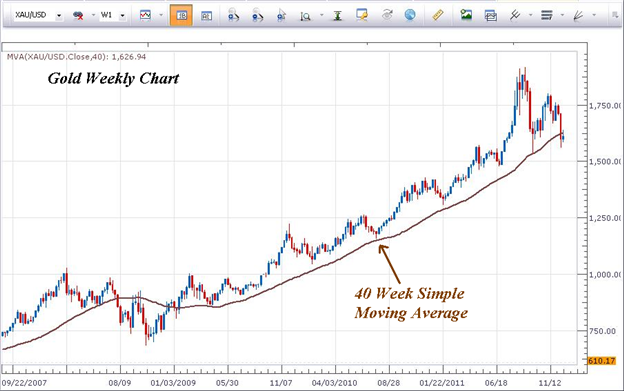
Last week, Gold broke below the 40 week moving
average for the first time since January 2009. This technical indicator
is watched by many large institutions to give clues about trend
direction.
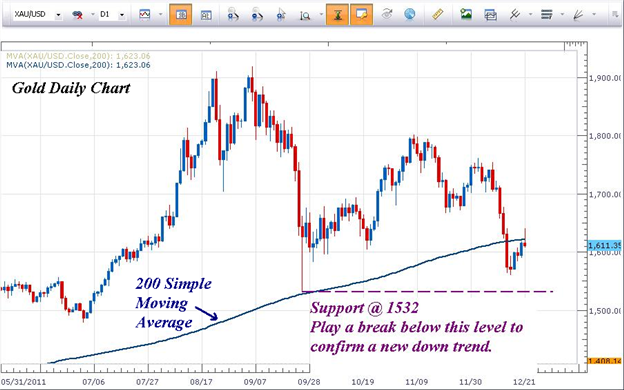
Additionally, Gold broke below the 200 Day Simple
Moving Average last week which is another technically bearish sign.
Earlier today, gold pierced the 200 SMA from the bottom side and
immediately turned lower. This respect for these important moving
averages indicates the appetite for owning gold at these prices is
waning.
Therefore, we’ll look for technical reasons to sell gold. Since the low of late September 2011 is
1532, place an entry to sell 1 point below at 1531. Prices trading to
these levels will indicate that prices are trading at levels not seen in
5 months which also indicates technical weakness. Place a stop just above a recent swing high on a break below 1531.
Crude Oil, Gold Expected to Decline as the New Year Begins
WTI Crude Oil (NY Close): $99.65 // +0.29 // +0.29%
European shares are little changed in early trade and S&P 500 stock index futures are treading water, pointing to neutral risk appetite trends and promising
a quiet end to the trading week and the year. Liquidity is almost
certainly evaporating as market participants wind down for the New Year
holiday, meaning any significant directional moves will likely wait
until 2012.
Looking ahead to January, risk aversion seems likely
to stage a comeback with the Eurozone debt crisis still unresolved and
global economic growth expectations pointing to a broad-based slowdown.
On balance, such an environment seems most supportive for safe-haven
assets like US Treasuries and the US Dollar at the expense of global shares and growth-geared commodities including crude oil.
On the technical front, prices put in a Hammer candlestick above resistance-turned-support at thetop
of a falling channel set from mid-November, hinting a pull-up is ahead.
Initial resistance lines up at 101.80. The channel bottom, now at
98.93, remains as near-term support.
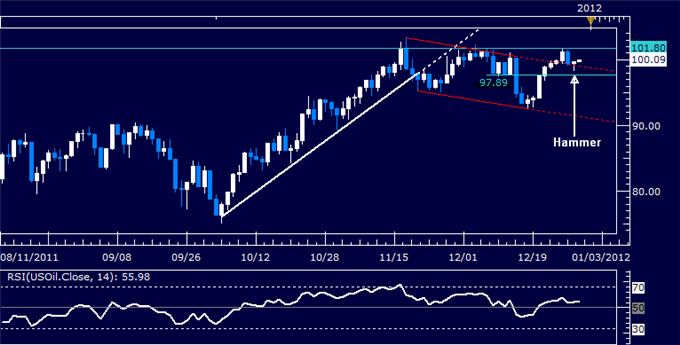
Daily Chart - Created by Zeshan
Spot Gold (NY Close): $1545.97 // -9.45 // -0.61%
With only hours left before global exchanges shutter
for the New Year holiday, little can be expected in terms of
significant directional momentum. Looking to 2012, the path of least
resistance appears to favor weakness as the Fed’s abandonment of QE saps
demand for gold as an inflation hedge while safe-haven capital inflows
boost the US Dollar, amounting to a de-facto headwind.
Sizing up the chart setup, prices are showing a
Hammer candlestick above support at 1532.45, the September 26 wick low,
pointing to a corrective bounce ahead after gold took out major multi-year trend line support
yesterday. Trend line resistance lines up at 1569.85. Renewed selling
through support initially exposes 1477.99, the July 1 low.
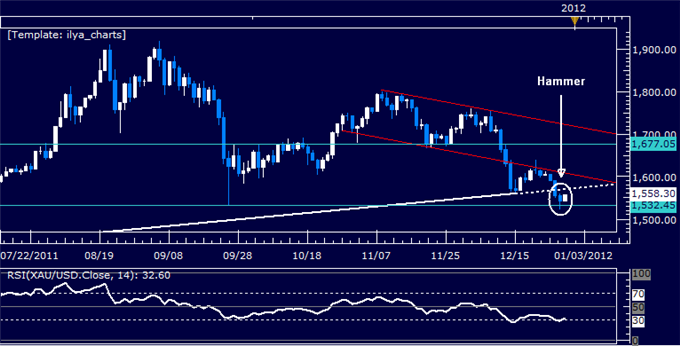
Daily Chart - Created by Zeshan
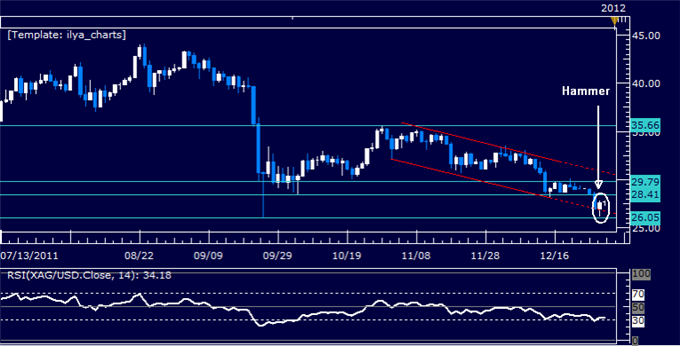
Spot Silver (NY Close): $27.70 // +0.59 // +2.19%
As with gold, the fundamental landscape appears to
favor weakness in the new year but little is likely to materialize in
the remaining hours of 2011. Prices put in a Hammer candlestick at the
bottom of a falling channel set from early November, hinting an upswing
is ahead. Near-term resistance is at 28.41, while the next significant
support level is marked by the September 26 low at 26.05.
Thursday, 29 December 2011
Me and Ze Capital Management Wishes Zeshan with deep gratitude on his 22nd Birthday

The birthday is not only a celebration of a person’s contributions to the world but it is a celebration of who that person is. It is an opportunity to express what a terrific friend, spouse, sibling, or child the birthday person is. A birthday is a chance to say to the birthday person that life would not be the same without that person’s smile, laugh, love, or support.
The gesture of wishing someone Happy birthday does not have to a grand, extreme gesture. A birthday truly is a day where the thought does count. While flowers, candy, and gifts will be appreciated, a person really wants to know that they are loved and remembered. A phone call to say happy birthday can make a person feel just as special as an elaborate dinner.
If a birthday is forgotten, wish the birthday person a Happy birthday as soon as possible. Even if their birthday was forgotten, they will feel better knowing that you still remembered. As for gifts, any gift for a belated birthday will be appreciated with the same thankfulness that a gift received on their birthday does. No one is perfect and everyone forgets from time to time, but whatever you do-do not ignore it.
There are certain ages that people feel the birthdays are more special than other birthdays. This will vary from person to person and really has no rhyme or reason. For the special birthday sometimes a large birthday party is thrown to celebrate it or sometimes the person just wishes do something out of the ordinary so they do not feel their life is passing by. Depending on the level of adventure in the person the out of ordinary thing could range from taking a trip to skydiving.
While some people hate their birthday or dread a certain age, birthdays should be viewed as a glorious time. Age is only a number and does not mean one cannot have adventures. It is amazing to hear about people in their 70s and 80s who still do incredible things like hike a mountain or even just live alone. These people did not let age affect them. To them their birthday, while it meant they were another year old did not affect them. Age is just a number to them and as long as their body can hold up, they will live their life as an adventure. As long as, one can dream it, one can do it and what better time to dream on a birthday.
Tuesday, 27 December 2011
Where are Gold and Silver Headed in 2012????
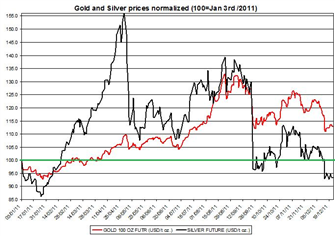
Gold and
silver changed direction very sharply throughout 2011: despite the sharp
gains of gold and silver prices up until September, precious metals
prices changed direction during the last quarter of the year and
plummeted in a very short period of time; from this drop precious metals
didn't recover throughout the remainder of the year. Silver declined
below its initial price level from the beginning of the year, while gold
ended the year only 12% above its price level from January 3rd
2011. Can we learn from the developments in the bullion market during
2011 to predict what will be the direction of gold and silver prices in
2012? Let's examine up close the development of precious metals in 2011
and offer a broad prediction for gold and silver in 2012.
Gold and Silver in 2011
During the first few month
of the year, silver sharply outperformed gold and by the end of April
silver rose by nearly 56%, while gold by only 9% from the beginning of
the year. Once the price of silver sharply rose, CME raised the margins on silver; this action had an immediate response in the market and by May 17th
silver declined to 7% above the initial price level. The next rally
came from May to the beginning of September for both gold and silver.
This rally came when the uncertainty in the markets rose especially
around the speculation around the stability of the U.S. economy. This
included the debate around raising the debt ceiling. This rally came to a halt in September, not only because the CME intervened and raise margins on gold and silver, but also because the FOMC decided
to purchase $400 billion worth long term securities in lieu of another
Quantitative Easing Plan. Since many had anticipated the Fed to come up
with another stimulus plan, once there was only a plan to purchase LT
securities without expanding the monetary base, the decline of precious
metal prices soon followed.
The chart below shows the
development of gold and silver during 2011, in which gold and silver are
normalized to 100 for January 3rd, 2011.
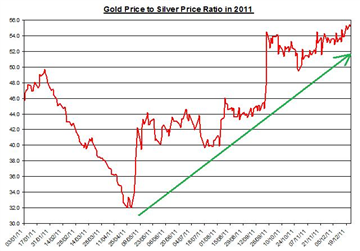
The next chart shows the
development of the ratio of gold to silver (gold /silver) during 2011;
the ratio had a downward trend during the first few months of the year
as silver outperformed gold, but towards the next several months the
ratio had an upward trend as silver underperformed gold.
Here are five factors that may have affected gold and silver to trade down in 2011:
- The FOMC's decision not to add another stimulus plan (quantitative easing 3) during the second part of 2011;
- CME's decisions to raise the margins on silver and gold;
- The European Debt Crisis that affected gold price especially during the second part of the year, via the liquidity problem that many EU banks and traders faced;
- The strengthening of the U.S dollar against other currencies (see below);
- The shift in market sentiment from considering gold a safe haven to a risky asset;
On the
other hand, I consider there were three factors that pushed up gold and
silver prices mainly during the first three quarters of 2011:
- The FOMC's decision to issue QE2 by the end of 2010; this action raised the monetary base and consequently positively affected gold and silver prices mainly during the first few months of the year;
- The speculation around the instability of the U.S. economy;
- The anticipation of the Fed issuing another stimulus plan (QE3).
Outlook for Gold and Silver in 2012
Let's also break this
forecast into factors that could push up precious metals prices compared
with factors that may pull bullion prices down.
Here are three reasons why I speculate gold and silver prices will remain high and even rise in 2012:
- Quantitative Easing Plan #3: if the U.S. economy won't start to recover, there is the possibility (even if it’s a small one) that the Fed will issue another stimulus plan (QE3);
- Low interest rates: as long as the U.S. will keep its inertest rates low, gold and silver are likely to remain high;
- Slowdown in the U.S. economy: since the U.S is entering an election year, the economic issues are likely to take the back seat; if the U.S. economy will enter a double dip rescission, precious metals are likely to thrive.
Here are four reasons to trade down gold and silver in 2012:
- Recovery of U.S. Economy: If the U.S. economy will show signs of slow recovery as in the last few months of 2011, this may curb the rally of bullion prices and lower the chances of the Fed issuing another stimulus plan (QE3);
- The European Debt Crisis: if the EU will continue to struggle in dealing with the debt crisis, this may also adversely affect gold and silver;
- CME Margins: as seen in 2011, CME is likely to keep a vigilant eye on the development in the bullion market; if there will be a sharp gain, be sure there is the possibility that CME will intervene and raise margins again.
- USD: If the U.S. dollar will continue to strengthen against other currencies including CAD and AUD, this may also negatively affect gold and silver prices.
Considering the statements
mentioned above, I speculate there is a good chance gold and silver will
perform poorer in 2012 than in 2011. If there will be another stimulus
plan or an event that will stir up the markets then there is a small
chance that gold and silver will perform better in 2012 than in 2011.
Zeshan Muhammad Ali Awan
Euro Fundamentals Point To Further Weakness, Sterling Maintains Range
Euro: Record Deposits At E.C.B, Further Easing Ahead
The Euro maintained the
narrow range from the previous week amid the drop in market
participation, but the single currency remains poised to weaken further
over the near-term as the fundamental outlook for the region
deteriorates. Indeed, commercial banks in Europe parked a record EUR
411B with the European Central Bank overnight, and the ongoing turmoil
in the financial system may prompt the Governing Council to ease
monetary policy further as the economy faces an increased risk of a
major economic downturn in 2012.
In response, German Finance
Minister Wolfgang Schaeuble argued that it’s imperative for the EU to
stem the risk for contagion, but it seems as though the governments
operating under the monetary union are becoming increasingly reliant on
monetary support as the EU struggles to restore investor confidence.
According to Credit Suisse overnight index swaps, market participants
are pricing a 25% chance for a 25bp rate cut at the next policy meeting
on January 12, and we may see ECB President Mario Draghi continue to
target the benchmark interest rate in 2012 as the Governing Council
moves away from its nonstandard measures. In turn, expectations for
lower borrowing costs should dampen the appeal of the single currency,
and we expect the EUR/USD to resume the downward trend from the end of
October as European policy makers struggle to calm market fears. As the
EUR/USD fails to push back above the 38.2% Fibonacci retracement from
the 2009 high to the 2010 low around 1.3100, we may see the exchange
rate give back the rebound from January (1.2872), which could expose the
23.6% Fib around 1.2630-50.
British Pound: To Consolidate Further Amid Expectations For More Q.E
The British Pound pared the
overnight advance to 1.5699 and the sterling may continue to lose ground
during the North American trade as market sentiment deteriorates. As
the European debt crisis drags on Britain, Bank of England Governor
Mervyn King has certainly become increasingly cautious towards the
region, and the central bank head is likely to take additional steps to
shield the U.K. economy as it faces an increased risk of a double-dip
recession. As the BoE keeps the benchmark interest rate at the
record-low, we are likely to see the MPC expand its asset purchase
program beyond the GBP 275B target, but we may see market participants
treat the sterling as a safe haven in 2012 as the U.K. government
remains ahead of the curve in addressing its budget deficit. As the
GBP/USD continues to trade within the broad range carried over from the
previous month, we should see the pound-dollar continue to consolidate
over the remainder of the year, but the sterling may come under
increased pressure should we see trader sentiment weaken further.
U.S. Dollar: Index Maintains Narrow Range, Risk Aversion Sets In
U.S. dollar price action was largely mixed on Tuesday, with the Dow Jones-FXCM U.S. Dollar Index (Ticker: USDOLLAR)
maintaining the narrow range from the previous week, but we should see
the greenback regain its footing during the North American trade as the
U.S. equity market opens lower. As risk appetite falters, the shift in
market sentiment should prop up the reserve currency, and the greenback
may appreciate ahead of the New Year as there appears to be a flight to
safety. However, as we’re anticipating to see positive developments
coming out of the world’s largest economy, a slew of
better-than-expected data could spark a rebound in trader sentiment, and
the greenback may struggle to hold its ground should we see a rise in
risk-taking behavior.
Prepared by Zeshan Muhammad Ali Awan
Here is How to Trade Forex Majors like the Euro During Active Hours
Zeshan Muhammad Ali Awan (Director Technicals)
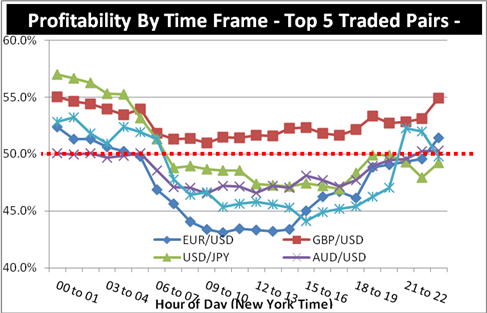
Our past research shows that traders could be well-served restricting their trading to less-active trading hours, as general trader profitability tends to improve when markets are less volatile. But what if you can’t trade when it’s quiet? For traders who feel the need to be in the market during the more volatile times, here is some advice about how to do it.
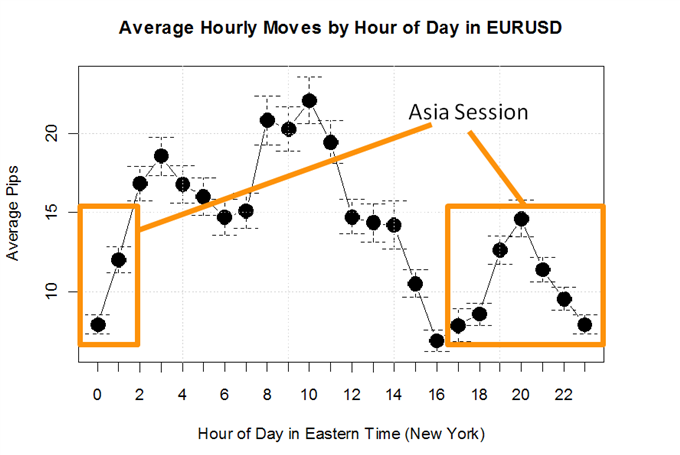
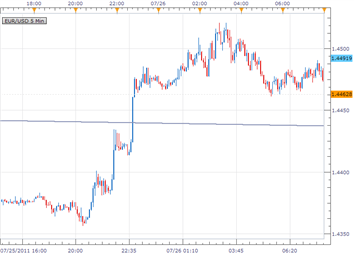
The chart above emphasizes that FXCM clients tend to do poorly in the 5 most popularly traded pairs during the North American daytime. If we compare these results with measures of volatility, we can see that this poor performance seems directly correlated to sharp price swings, as this time of day tends to be the most volatile. The chart below shows the average hourly moves in pips for the EUR/USD, the most popular currency pair to trade. You can see that traders’ best results coincide with the times of day that have lower volatility, such as the Asia trading session.
Our previous article showed that the highly popular Relative Strength Index trading strategy produced significantly better risk-adjusted returns if we limited it to trade exclusively during the least-volatile hours of the trading day, 2 PM to 6 AM Eastern Time (New York).
What Strategy Should I Use to Trade the US Daytime?
As mentioned before, we advise traders to trade during the lower-volatility times of day due to the risks that volatility present, and the better results we see in the range trading strategies that FXCM clients tend to use. Some traders may prefer to trade during the volatile US daytime, however. So, if you’re going to do that, make sure that you use the appropriate strategy at the appropriate time. Do not try to range trade. Instead, do the opposite: trade breakouts.
What is a Breakout?
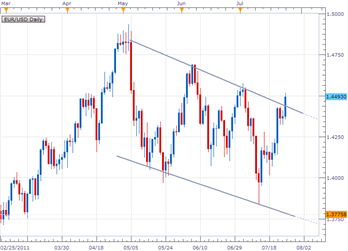
A breakout is when a currency that has been trapped in a range or channel on the chart breaks through support or resistance, escaping the channel. When this happens, the movement in prices tends to be very powerful, and can create a trading opportunity.
Here is an example where the EUR/USD Daily chart had a channel for two months. You can see that when this channel broke, the move was swift and powerful.
How Do You Trade Breakouts?
Trading breakouts is almost the exact opposite of trading ranges. When price moves upwards through resistance, look to buy. When it moves downard through support, look to sell. In the above example, a range trader would have tried to sell at the top of the channel and would have likely lost money. A breakout trader would instead have looked to buy.
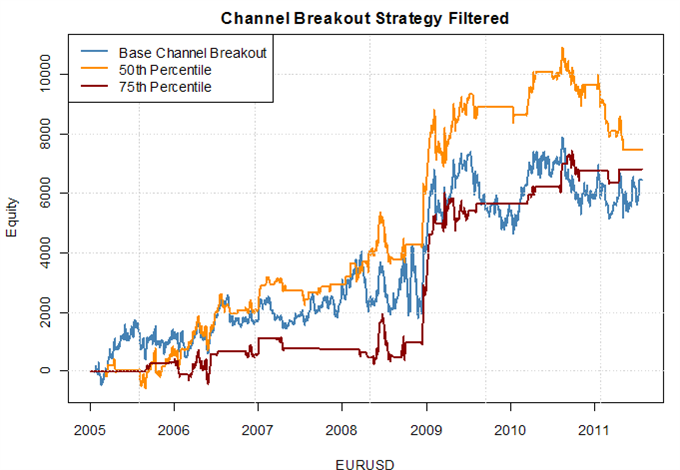
Sample Strategy: Channel Breakout
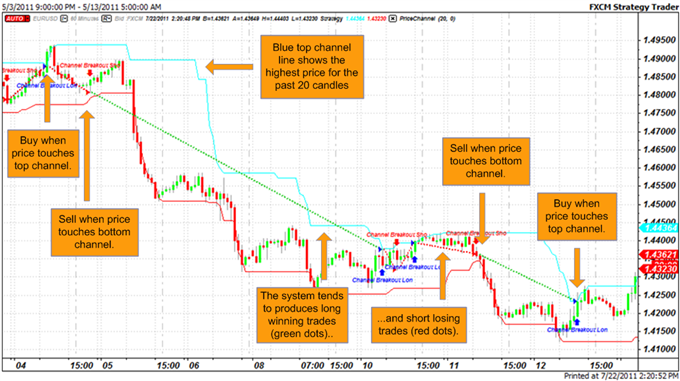
The Channel Breakout strategy is quite straightforward and has performed fairly well historically. the system draws a channel surrounding price action, with the top of the channel set at the highest high and the bottom set at the lowest low of the past twenty bars. In the chart below, you can see the top of the channel in light blue and the bottom of the channel in red. The green dotted line shows profitable trades made by the system, while the red dotted line shows losing trades made by the system.
We sell the currency pair if the price breaks below the channel bottom. If price quickly reverses, we will be taken out of the trade at a loss. Yet if price continues lower, we stand to see profits on the continued moves.
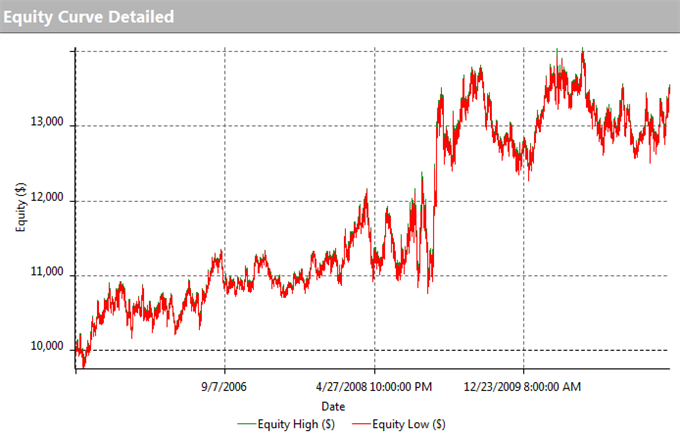
Thus we can conceptualize this this trade system might work especially well during times of high volatility, when channels tend to be broken. Let’s test by looking at how well it has done on the Euro/US Dollar in the past several years:
Channel Breakout Strategy on EURUSD Pair from 2001-2011, 60min Chart
The channel breakout system did reasonably well overall, and especially well during times of strong market volatility in late 2009. Yet it has also had long stretches of underperformance and noteworthy losing streaks. Since we know that breakout strategies tend to work better during times of higher volatility, how can we instruct our system to trade only during those times?
When Should I Look to Trade Breakouts?
Every day, we publish Volatility Percentile figures on the DailyFX Technical Analysis page for reference. The Volatility Percentile is derived from FX options prices. The higher the number, the more volatile options traders expect the currency pair to be. We can use these volatility percentages to judge when it is best to use particular strategies. When volatility percentages are high, we look to trade breakout strategies. When they are low, we look to avoid them.
When looking at the Channel Breakout strategy above, a quick optimization shows that the strategy improves noticeably when we apply filters. We simulate two cases below. In one case, the strategy is only allowed to trade when our Volatility Percentile is above 50%. In the other, it is only allowed to trade when it is above 75%. As you can see in the chart below, in both cases we see better overall results than the “base case” of letting the system trade at any time.
With the 50 percentile filter, the strategy is allowed to trade about half the time. With the 75 percentile filter, the system can only trade about 25% of the time. Over time, the 50 percentile filter has been shown to prevent many of the losing trades in the system, while preventing only a few of the winning trades. This has produced the best historical returns on an overall final net-profit basis but has also shown significant losing streaks.
With the 75 percentile filter, prevents even more trades – both good ones and bad ones. While the overall result over the past six years has not been quite as good as the 50 percentile one, there were few times of significant losses. Indeed, when we fully take risk into consideration, we prefer the 75th percentile filter, as it makes rather fewer losing trades and we are glad to forego some potential profits in order to lower our risk of potential loss.
Has the Dollar Bottomed for a Decade or More? A Smacth Ahead.?
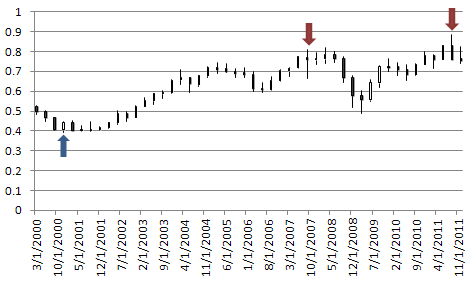
A scan of yearly and quarterly charts reveals reversal opportunities in the USDCHF (yearly and quarterly), AUDUSD (quarterly), NZDUSD (quarterly), and USDCAD (quarterly). I define a reversal with yearly data as a new 5 year high/low, a close above/below the prior year’s close, and a range for the year that is at least as large as the average range for the last 5 years. A reversal with quarterly data uses 12 periods (3 years) (for monthly 12, for weekly 13, and for daily 20). No method is immune to false signals, but key reversals indicate favorable reward/risk opportunities because a potentially significant pivot (high or low) is identified with minimal lag (when viewed in the context of the time frame being analyzed).
Many decade long turns have been indicated by yearly or even quarterly key reversals. A look at EURUSD yearly bars illustrate this point (arrows indicate yearly key reversals). The study also highlights the tendency for exchange rates to reverse during high volatility environments (hint – USDJPY volatility is NOT high which decreases the probability that an important low is in place).
EURUSD YEARLY CANDLES (since 1982 + DEM rates)
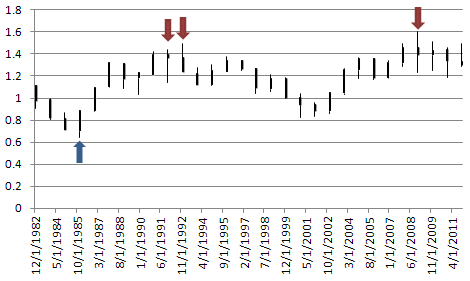
Created by Zeshan
The most recent yearly and quarterly key reversals are for the USDCHF, AUDUSD, NZDUSD, and USDCAD.
USDCHF YEARLY CANDLES (since 1982)
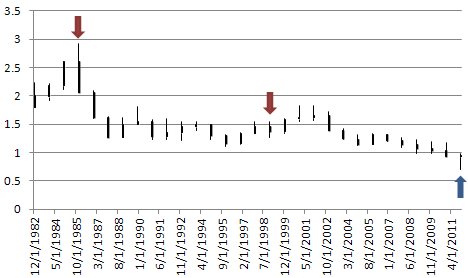
Created by Zeshan
Bearish reversals occurred in 1985 and 1998. 1998 was a false signal. This is the first yearly bullish key reversal.
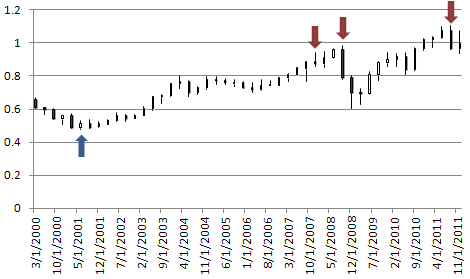
USDCHF QUARTERLY CANDLES (since 2000)
Created by Zeshan
A bearish key reversal occurred in the 4th quarter of 2000. The 3rd quarter reversal of 2011 was the first quarterly reversal (bullish or bearish) since 2000.
AUDUSD QUARTERLY CANDLES (since 2000)

Created by Sarah
A bullish reversal occurred in the 2nd quarter of 2001. Bearish reversals occurred in the 4th quarter of 2007 and the 3rd quarter of 2008. The 2007 reversal didn’t pan out. Price fell another 1900 pips (to the low) after the 2008 reversal (close to close was 897 pips). The most recent reversal occurred during the 3rd quarter of 2011.
NZDUSD QUARTERLY CANDLES (since 2000)

Created by Zeshan
A bullish reversal occurred in the 4th quarter of 2000. Bearish reversals occurred in the 3rd quarter of 2007 and the 3rd quarter of 2011. The 2007 reversal didn’t pan out immediately as the actual high was not until the 1st quarter of 2008.
USDCAD QUARTERLY CANDLES (since 2000)
Created by Zeshan
Since 2000, there has never been a USDCAD bearish quarterly reversal but there have been 3 bullish reversals; Q1 2004, Q4 2007, and Q3 2011. The 2004 reversal gave way to gains in the next quarter but eventually failed. The 2007 reversal resulted in a run from 1 to 1.30 within one year.
Summary
The most recent large degree reversals paint a picture of USD strength in 2012. Unless your holding period is a year or more (Ilya), I do not suggest treating these reversals as signals. Rather, understand that conditions for the pairs examined are consistent with previous long term reversals. This knowledge should help in constructing favorable reward/risk opportunities in 2012.
DailyFX Top Trade Opportunities of 2012
Zeshan Muhammad Ali Awan
(Director Technicals Me & Ze Capital management)
(Director Technicals Me & Ze Capital management)
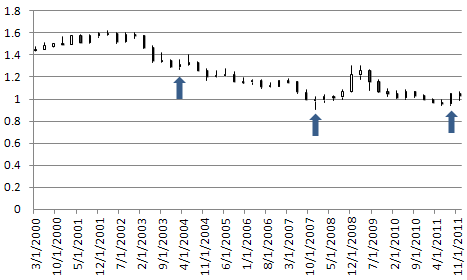
Long USDJPY: Safety, Manipulation and Yield
My call for a drive higher from USDJPY has, admittedly, been a consistent belief of mine for much of this past year. And yet, the pair has forged little progress to make that a reality. As they say, patience is a virtue. My trading approach is to combine rudimentary technicals and capital flow-based fundamentals; and both of these legs of analysis lead me to the same bullish conclusion for the foreseeable future: an advance for USDJPY. The first consideration is the pair incredible proximity to its record low. Extending historical extremes is exceptionally difficult. So, we need a catalyst for reversal. Short-term, we have the threat of manipulation from the BoJ and Ministry of Finance to offer economic relief. Medium-term, we have the possibility of a deepening financial rut that makes us more selective of safe havens (the dollar is undisputed for relative liquidity, credit market stability). And, long-term, the return of higher global rates supports the Fed moving while the BoJ continues a two-decade, near-ZIRP policy regime. The question of timing the entry is my biggest hang up; but starting small and building up with confirmation is a good strategy for me.
Long CADJPY: The Return of the Carry Trade
It’s inevitable that all we can think of heading into the New Year is the threat of the global financial crisis and another world-wide recession because uncertainty is immediate and there is still considerable long-risk exposure out there that needs to be unwound. However, if we look beyond the next shock, we will likely find that a lot of the leverage will have been worked down and idle capital will need to be reinvested. There will be a significant level of high-speculative investments; but the bulk of funds will be put behind lower risk investments – namely carry trade. Rates and rate differentials are already low; and they will be lower by the time underlying conditions turn around. A pair like AUDJPY will immediately have an advantage as its yield spread will likely be higher at the turn; but a lot of the capital appreciation that occurs in the exchange rate lies with the rate hikes (and expectations of those hikes). That puts CADJPY is a very good position as the Canadian dollar’s rate is already low. What’s more, there is an investment quality to the ‘loonie’ due to its commodity infrastructure and guaranteed export demand to China and the US.
Sarah Abbas Gondal
(Managing Director Me & Ze Capital management)
(Managing Director Me & Ze Capital management)
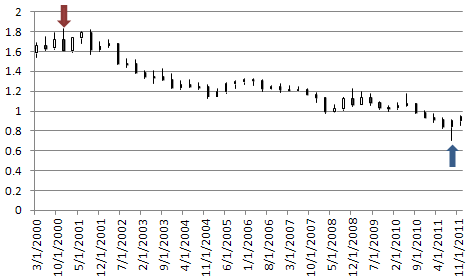
Long USDJPY
I would hate to think that the DailyFX analyst boat is getting pretty crowded with calls for a major reversal in the USDJPY. Yet I think there are many reasons why we might expect a significant USDJPY bounce, and the change in year is not the least of reasons the USDJPY might switch direction.
Instead of going long blindly into 2012, however, I’d like to see how we start off.
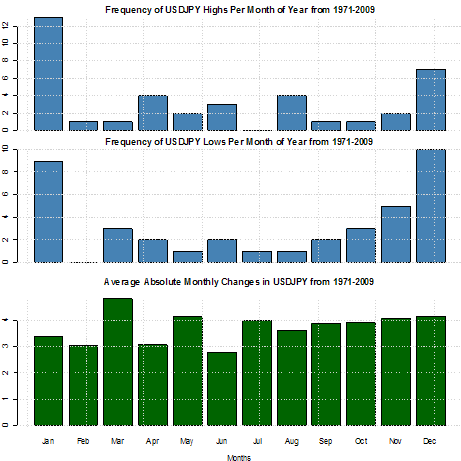
The above shows nearly 40 years of data in the USDJPY and the propensity for the pair to make its highs and lows for the year in the months of January and December. If we expected price to be completely random, there would be equal instances in which the highs/lows for the year were set for each month. Yet there were 9 instances in which the pair made its low for the year in USDJPY—nearly 25% of all years.
How might we look to trade this? With a long-term swing trade. If we see that the USDJPY respects 2011 lows in January, we could set orders to buy a break of January highs and set a stop below January lows. The limits would be set as conditions dictate. Yet we would have seasonality on our side, and having a central bank intent on keeping the USDJPY above record lows doesn’t hurt either.
Samera Mistry
(Director Business Development Me & Ze Capital Management)
Short AUDUSD and Short NZDUSD: Strong Evidence of Long Term Reversals
A scan of yearly and quarterly charts reveals reversal opportunities in the USDCHF (yearly and quarterly), AUDUSD (quarterly), NZDUSD (quarterly), and USDCAD (quarterly). I define a reversal with yearly data as a new 5 year high/low, a close above/below the prior year’s close, and a range for the year that is at least as large as the average range for the last 5 years. A reversal with quarterly data uses 12 periods (3 years) (for monthly 12, for weekly 13, and for daily 20). No method is immune to false signals, but key reversals indicate favorable reward/risk opportunities because a potentially significant pivot (high or low) is identified with minimal lag (when viewed in the context of the time frame being analyzed).
Many decade long turns have been indicated by yearly or even quarterly key reversals. The study also highlights the tendency for exchange rates to reverse during high volatility environments (hint – USDJPY volatility is NOT high which decreases the probability that an important low is in place).
AUDUSD QUARTERLY CANDLES (since 2000)
A bullish reversal occurred in the 2nd quarter of 2001. Bearish reversals occurred in the 4th quarter of 2007 and the 3rd quarter of 2008. The 2007 reversal didn’t pan out. Price fell another 1900 pips (to the low) after the 2008 reversal (close to close was 897 pips). The most recent reversal occurred during the 3rd quarter of 2011.
NZDUSD QUARTERLY CANDLES (since 2000)
A bullish reversal occurred in the 4th quarter of 2000. Bearish reversals occurred in the 3rd quarter of 2007 and the 3rd quarter of 2011. The 2007 reversal didn’t pan out immediately as the actual high was not until the 1st quarter of 2008.
The most recent large degree reversals paint a picture of USD strength in 2012. Unless your holding period is a year or more (Ilya), I do not suggest treating these reversals as signals. Rather, understand that conditions for the pairs examined are consistent with previous long term reversals. This knowledge should help in constructing favorable reward/risk opportunities in 2012.
Mehak Awan
(Director Sales and marketing Me & Ze Capital Management)
(Director Sales and marketing Me & Ze Capital Management)
Short EURUSD: The Multi-Year Euro Downtrend Continues
Broadly speaking, the Euro has been trending lower since July 2008 having peaked above 1.60 against the US Dollar. More of the same seems almost certainly ahead. The Eurozone debt crisis remains unresolved, presenting a two-pronged problem. On one hand, it amplifies already considerable headwinds facing economic growth. Soaring borrowing costs amid fears of a default within the currency bloc stymie activity as individuals and businesses find it more expensive to spend and invest. In turn, slower growth reduces regional governments’ tax intake, making it harder to reduce deficits, stoking already considerable sovereign solvency fears and producing a vicious cycle. Economists’ consensus forecasts suggest growth in the Euro Zone will stall in 2012 and recovery only modestly in the following year. Meanwhile, growth in the US is expected to accelerate over the same period. This beckons aggressive monetary stimulus from the ECB, suggesting interest rate differentials will narrow firmly in favor of the US Dollar even if the Federal Reserve opts to make good on its promise to keep benchmark borrowing costs on hold through mid-2013.
On the other hand, it threatens to unleash another market-wide selloff and global credit crunch, plunging worldwide finance into another existential crisis just three years after the 2008 debacle. In the event of a default in a large country like Italy or Spain countless banks, funds and other institutions would be forced to book sharp losses. For some, taking such a hit will prove unbearable and they will be forced to go out of business, sending ripple effects across the markets as their creditors now face losses, and so forth. Those that remain standing will rush to raise new capital, with banks and funds dumping assets at fire-sale prices to meet reserve and margin requirements. This translates into another broad-based rout across asset classes, erasing incalculable amounts of firms’ and individuals’ wealth. It goes without saying that such an outcome would outright crush private-sector economic activity on a global scale. Needless to say, such an outcome bodes very well for safe-haven currencies and in particular for the US Dollar, where official intervention does not undermine its store-of-value properties (as is the case with the Japanese Yen and Swiss Franc, typically the other go-to safety vehicles in the FX space).

Zeshan Muhammad Ali Awan
Foreign Investment in US Equities
While on the surface, the recommendation appears to be non-currency specific, we view this as an extremely attractive opportunity for a portfolio hedge in 2012 and potential arbitrage strategy. Currencies have been broadly outperforming against the US Dollar in recent years and it finally appears as though this trend could be on the verge of some form of a reversal back in favor of the buck. However, long USD positions have also been quite risky and exposure to the Greenback might bring with it some unwelcome stress. As such, our recommendation for non-US residents is to instead, put their money into US equities. What does this mean?
Here is how we see this playing out. Should current correlations stand, if US equities are to head higher, then the investor will benefit from the US equity return, but at the same time, likely have his/her investment offset by the sell-off in the US Dollar and appreciation in his/her local currency on the resurgence in risk appetite and outflow from the safe-haven US Dollar. If on the other hand US equities head lower, then the risk off market environment will allow the investor to offset his/her loss in US stocks through the appreciation in the US Dollar on its safe-haven flows (remember – the investor in invested in US equities and thereby has USD exposure).
So if this is the case, then where is the benefit in this trade, and why even do it? Well, what if we see a break down in familiar correlations where the US equity market rallies and the US Dollar also rallies at the same time? What if we see a situation where US equities and the US Dollar become positively correlated? In this scenario, the investor stands to benefit a great deal and will not only make money from his investment in US equities, but will also enhance his/her returns on the appreciation in the US Dollar.
The global recession appears to be moving in phases, and with the markets now dealing with phase two of the crisis in Europe, we can start to anticipate the transition to phase three, where we believe that China, the commodity bloc economies and emerging markets will all be exposed. At the same time, we see a first in and first out type of situation, with the US economy the first to emerge from the global recession which should translate into a more upbeat outlook on low valuation US equities and the US Dollar as well, on a narrowing of yield differentials back in favor of the Greenback as the Fed begins to signal a reversal of ultra accommodative monetary policy.
Sarah Abbas Gondal
Short EURGBP: U.K. Remains Ahead Of the Curve
As European policy makers struggle to address the sovereign debt crisis, we expect the single currency to face additional headwinds in 2012. Although the EUR/USD will be the center of attention for most FX traders, I will be keeping a close eye on the EUR/GBP.

After actively trading the euro-pound throughout 2011, the British Pound has recent strengthened against its European counterpart, and the sterling should continue to outpace the single currency in the following year as the U.K. government remains ahead of the curve in balancing their public finances. As the euro-area faces an increased threat of a credit-rating downgrade, we expect the heightening risk for contagion to drag on the Euro, and the exchange rate should continue to push lower in the following year as the EU fails to restore investor confidence. However, as the fundamental outlook for the U.K. and Euro-Zone remains clouded with high uncertainty, monetary policy will be a key driver of price action for the EUR/GBP.
As the European Central Bank and the Bank of England carry their easing cycle into 2012, we expect to see additional monetary support in 2012, but the preemptive approach taken by the BoE should help to increase the appeal of the sterling. At the same time, with record-low rates in the U.K., we may see market participants move away from the Euro and into the British Pound should we see the flight to safety gather pace.
Sarah Abbas Gondal
Short AUDUSD: Risks to Global Growth, China
We have all witnessed the extreme volatility and resulting shocks to markets the crisis in Europe has ignited over the past year. Mainly, this is due to the debt contagion fears spread rapidly not only across the region, but also across the world’s most developed economies. Considering the magnitude of the EU crisis, it comes as no surprise that an ominous cloud has gone relatively unnoticed under the radar: China. As the Chinese government struggles to achieve a “soft landing” from the extraordinary measures taken at the height of the financial crisis, the economy continues to show signs of stress as growth in one of the world’s fastest growing economies begins to slow. China’s trade surplus has continued to shrink as a housing bubble appears to be ready to burst while current fears of a credit crunch have fueled concerns of a substantial slowdown in growth. As Australia’s top trade partner, a slowdown in China is likely to put pressure on the aussie as decreased demand for Australian exports weighs on the isle-nation’s economy.
In addition to the China story, the Reserve Bank of Australia is also likely to aggressively cut rates in 2012 with Credit Suisse overnight swaps now factoring in more than 116 basis points in interest rate cuts for the next twelve months, the highest expectations for cuts among the developed economies. In spite of two rate cuts towards the tail end of 2011, increased concerns over the debt crisis in Europe and expectations for further weakness in global trade will continue to put pressure on RBA Governor Glenn Stevens to soften monetary policy and maintain an accommodative environment for businesses.
AUDUSD Daily
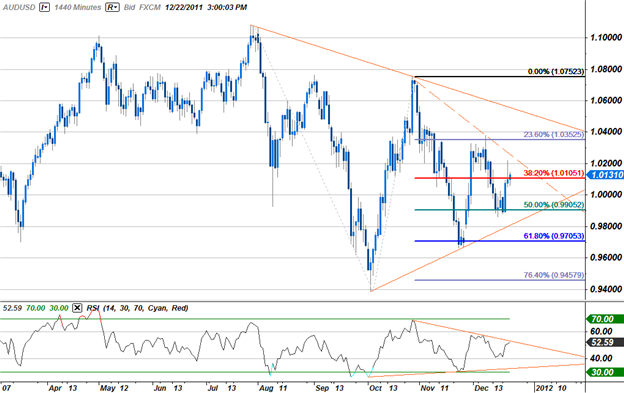
The AUD/USD has been in consolidation since the June 27th high at 1.1079, with the pair continuing to hold within the confines of a wedge formation for the past 5 months. A Fibonacci extension taken from the June and October highs reveal clear resistance at the 23.6% extension at 1.0350 followed by the upper bound trendline of the wedge formation. Our bias will remain intact so long as this level is not compromised, with a breach above eyeing targets at 1.0750, and the 1.01-figure. Support targets are held at the 50% extension at the 99-handle, with a break here exposing targets at trendline support dating back to the October 4th lows and the 61.8% extension at the 0.97-handle. This level will remain paramount for the aussie with a break below risking substantial losses for the high yielder as it looks to test the 2011 lows at the 0.94-figure.
Samera Mistry
Swiss Franc to Underperform in 2012
Long EURCHF and USDCHF: What’s going on Across the Pond besides the Debt Crisis?
While the Euro-zone faces a recession even if it is able to climb the wall of worry and convince market participants that none of its member countries will default on their debt, other European nations are facing stress. The one of greatest interest, in my opinion, is Switzerland.
To put the Swiss economy in perspective, one needs to look no further than how the Swiss Franc performed from the start of 2011 until early August. The EUR/CHF opened the year at 1.2500, and as the United States’ debt deadline approached, coupled with the Euro-zone debt crisis, the EUR/CHF quickly approached parity. Recent data showed that Swiss growth in the third quarter had stumbled to a meager 0.2 percent rate on a quarterly basis, or 1.5 percent year-over-year. By September, Inflation was at a paltry 0.2 percent yearly rate, well-below the Swiss National Bank threshold.
The combination of these downside pressures on the Swiss economy – slowing growth, slower inflation, capital flight to the Swiss Franc which damaged the export sector – forced the SNB to place a 1.2000 floor in the EUR/CHF on September 6. Recent speculation suggests that the floor might be raised to 1.2500 or 1.3000 in the coming weeks now that the SNB can’t legally implement negative interest rates to deter Franc appeal. The SNB will be forced to act, regardless of what is transpiring in the Euro-zone.
Given the fundamental backdrop of Switzerland, it appears that the Franc will lose value over the course of 2012. In regards to the debt crisis itself, the European Central Bank may ultimately be forced to print money to help the periphery nations. This has implications for the Franc.
If the ECB chooses not to explicitly print money, the sovereign debt crisis is likely to get worse before it gets better, and investors will lose confidence in the future of the Euro-zone, and thus the Euro, fleeing to the Franc. This downside pressure on the EUR/CHF will force the SNB’s hand. Conversely, if the ECB does print money, the Euro will likely lose value, much like what the U.S. Dollar did after the Federal Reserve decided to inject the financial system with more U.S. Dollars; this too will put pressure on EUR/CHF. Both outcomes point towards a weaker Euro, and thus a weaker EUR/CHF (the third scenario, in which joint Eurobonds are issued, is off the table for now as Germany continues to oppose such an idea).
The deterioration of the Euro-zone coupled with the likelihood of the ECB printing money at some point in the coming months suggests that there will be increased downside pressure on the EUR/CHF, and thus, on the SNB to hold the 1.2000 floor. To head off these pressures, the SNB might preemptively raise the EUR/CHF floor to 1.2500 or 1.3000 in the coming months. Major banks have suggested that the floor could rise as high as 1.4000.
Even in the most bullish of scenarios, the outlook for the Franc remains weak. If the Euro-zone avoids a recession or collapse, the Swiss economy is primed to be dragged into a recession of its own, and the SNB will act accordingly. As such, promising trades in 2012 look long EUR/CHF and USD/CHF.
Subscribe to:
Posts (Atom)