Why Do Traders Lose?If you've been trading for a long time, you no doubt have felt that a monstrous, invisible hand sometimes reaches into your trading account and takes out money. It doesn't seem to matter how many books you buy, how many seminars you attend or how many hours you spend analyzing price charts, you just can't seem to prevent that invisible hand from depleting your trading account funds.
Which brings us to the question: Why do traders lose? Or maybe we should ask, "How do you stop the Hand?" Whether you are a seasoned professional or just thinking about opening your first trading account, the ability to stop the Hand is proportional to how well you understand and overcome the Five Fatal Flaws of trading. For each fatal flaw represents a finger on the invisible hand that wreaks havoc with your trading account.
Fatal Flaw No. 1 -- Lack of Methodology
If you aim to be a consistently successful trader, then you must have a defined trading methodology, which is simply a clear and concise way of looking at markets. Guessing or going by gut instinct won't work over the long run. If you don't have a defined trading methodology, then you don't have a way to know what constitutes a buy or sell signal. Moreover, you can't even consistently correctly identify the trend.
How to overcome this fatal flaw? Answer: Write down your methodology. Define in writing what your analytical tools are and, more importantly, how you use them. It doesn't matter whether you use the Wave Principle, Point and Figure charts, Stochastics, RSI or a combination of all of the above. What does matter is that you actually take the effort to define it (i.e., what constitutes a buy, a sell, your trailing stop and instructions on exiting a position). And the best hint I can give you regarding developing a defined trading methodology is this: If you can't fit it on the back of a business card, it's probably too complicated.
Fatal Flaw No. 2 -- Lack of Discipline
When you have clearly outlined and identified your trading methodology, then you must have the discipline to follow your system. A Lack of Discipline in this regard is the second fatal flaw. If the way you view a price chart or evaluate a potential trade setup is different from how you did it a month ago, then you have either not identified your methodology or you lack the discipline to follow the methodology you have identified. The formula for success is to consistently apply a proven methodology. So the best advice I can give you to overcome a lack of discipline is to define a trading methodology that works best for you and follow it religiously.
Fatal Flaw No. 3 -- Unrealistic Expectations
Between you and me, nothing makes me angrier than those commercials that say something like, "...$5,000 properly positioned in Natural Gas can give you returns of over $40,000..." Advertisements like this are a disservice to the financial industry as a whole and end up costing uneducated investors a lot more than $5,000. In addition, they help to create the third fatal flaw: Unrealistic Expectations.
Yes, it is possible to experience above-average returns trading your own account. However, it's difficult to do it without taking on above-average risk. So what is a realistic return to shoot for in your first year as a trader -- 50%, 100%, 200%? Whoa, let's rein in those unrealistic expectations. In my opinion, the goal for every trader their first year out should be not to lose money. In other words, shoot for a 0% return your first year. If you can manage that, then in year two, try to beat the Dow or the S&P. These goals may not be flashy but they are realistic, and if you can learn to live with them -- and achieve them -- you will fend off the Hand.
Fatal Flaw No. 4 -- Lack of Patience
The fourth finger of the invisible hand that robs your trading account is Lack of Patience. I forget where, but I once read that markets trend only 20% of the time, and, from my experience, I would say that this is an accurate statement. So think about it, the other 80% of the time the markets are not trending in one clear direction.
That may explain why I believe that for any given time frame, there are only two or three really good trading opportunities. For example, if you're a long-term trader, there are typically only two or three compelling tradable moves in a market during any given year. Similarly, if you are a short-term trader, there are only two or three high-quality trade setups in a given week.
All too often, because trading is inherently exciting (and anything involving money usually is exciting), it's easy to feel like you're missing the party if you don't trade a lot. As a result, you start taking trade setups of lesser and lesser quality and begin to over-trade.
How do you overcome this lack of patience? The advice I have found to be most valuable is to remind yourself that every week, there is another trade-of-the-year. In other words, don't worry about missing an opportunity today, because there will be another one tomorrow, next week and next month...I promise.
I remember a line from a movie (either Sergeant York with Gary Cooper or The Patriot with Mel Gibson) in which one character gives advice to another on how to shoot a rifle: "Aim small, miss small." I offer the same advice in this new context. To aim small requires patience. So be patient, and you'll miss small.
Fatal Flaw No. 5 -- Lack of Money Management
The final fatal flaw to overcome as a trader is a Lack of Money Management, and this topic deserves more than just a few paragraphs, because money management encompasses risk/reward analysis, probability of success and failure, protective stops and so much more. Even so, I would like to address the subject of money management with a focus on risk as a function of portfolio size.
Now the big boys (i.e., the professional traders) tend to limit their risk on any given position to 1% - 3% of their portfolio. If we apply this rule to ourselves, then for every $5,000 we have in our trading account, we can risk only $50 - $150 on any given trade. Stocks might be a little different, but a $50 stop in Corn, which is one point, is simply too tight a stop, especially when the 10-day average trading range in Corn recently has been more than 10 points. A more plausible stop might be five points or 10, in which case, depending on what percentage of your total portfolio you want to risk, you would need an account size between $15,000 and $50,000.
Simply put, I believe that many traders begin to trade either under-funded or without sufficient capital in their trading account to trade the markets they choose to trade. And that doesn't even address the size that they trade (i.e., multiple contracts).
To overcome this fatal flaw, let me expand on the logic from the "aim small, miss small" movie line. If you have a small trading account, then trade small. You can accomplish this by trading fewer contracts, or trading e-mini contracts or even stocks. Bottom line, on your way to becoming a consistently successful trader, you must realize that one key is longevity. If your risk on any given position is relatively small, then you can weather the rough spots. Conversely, if you risk 25% of your portfolio on each trade, after four consecutive losers, you're out all together.
Break the Hand's Grip
Trading successfully is not easy. It's hard work...damn hard. And if anyone leads you to believe otherwise, run the other way, and fast. But this hard work can be rewarding, above-average gains are possible and the sense of satisfaction one feels after a few nice trades is absolutely priceless. To get to that point, though, you must first break the fingers of the Hand that is holding you back and stealing money from your trading account. I can guarantee that if you attend to the five fatal flaws I've outlined, you won't be caught red-handed stealing from your own account.
Friday, 30 December 2011
Five Fatal Flaws of Trading By Me andZe Capital Management
US Dollar Should Be Across the Board Outperformer in 2012 Expect The Biggest Rally
- Euro set for yearly close below 1.3000
- Looking for additional Euro declines towards 1.2000 in 2012
- US Dollar see as most attractive currency in 2012
- Australian Dollar could be even more exposed then Euro going forward
- Third phase of global crisis expected to hit China
The Euro looks poised to
close out the year below 1.3000 after dropping to a fresh 2011 low by
1.2858 on Thursday. The bearish close is rather appropriate in the grand
scheme of things considering the Eurozone crisis was at the center of
all things troubled in 2011. From here, we would expect to see Euro
declines accelerate into 2012, particularly against the US Dollar, with a
measured move objective coming in somewhere near the 1.2000 area.
Broadly speaking, we anticipate across the board US Dollar bids against
all major and minor currencies, with the US Dollar seen as the most
attractive currency in 2012 on both its safe haven appeal and the
prospects for a sustained economic recovery in the United States.
We also project relative
underperformance even against the Euro in the China correlated commodity
bloc and emerging market currencies, on the expectation that a third
phase of the global recession will soon fully reveal itself in China
into 2012. We think this will be the next big shoe to drop, and we
therefore warn against long positions, specifically in the Australian
Dollar which we contend is highly overvalued and quite exposed at
current levels.
Looking Ahead to 2012 - Foreign Investment in US Equities
While on the surface, the
recommendation appears to be non-currency specific, we view this as an
extremely attractive opportunity for a portfolio hedge in 2012 and
potential arbitrage strategy. Currencies have been broadly outperforming
against the US Dollar in recent years and it finally appears as though
this trend could be on the verge of some form of a reversal back in
favor of the buck. However, long USD positions have also been quite
risky and exposure to the Greenback might bring with it some unwelcome
stress. As such, our recommendation is foreign investment in US equities. What does this mean?
Here is how we see this
playing out. Should current correlations stand, if US equities are to
head higher, then the investor will benefit from the US equity return,
but at the same time, likely have his/her investment offset by the
sell-off in the US Dollar and appreciation in his/her local currency on
the resurgence in risk appetite and outflow from the safe-haven US
Dollar. If on the other hand US equities head lower, then the risk off
market environment will allow the investor to offset his/her loss in US
stocks through the appreciation in the US Dollar on its safe-haven flows
(remember – the investor in invested in US equities and thereby has USD
exposure).
So if this is the case, then
where is the benefit in this trade, and why even do it? Well, what if
we see a break down in familiar correlations where the US equity market
rallies and the US Dollar also rallies at the same time? What if we see a
situation where US equities and the US Dollar become positively
correlated? In this scenario, the investor stands to benefit a great
deal and will not only make money from his investment in US equities,
but will also enhance his/her returns on the appreciation in the US
Dollar.
The global recession appears
to be moving in phases, and with the markets now dealing with phase two
of the crisis in Europe, we can start to anticipate the transition to
phase three, where we believe that China, the commodity bloc economies
and emerging markets will all be exposed. At the same time, we see a
first in and first out type of situation, with the US economy the first
to emerge from the global recession which should translate into a more
upbeat outlook on low valuation US equities and the US Dollar as well,
on a narrowing of yield differentials back in favor of the Greenback as
the Fed begins to signal a reversal of ultra accommodative monetary
policy.
TECHNICAL OUTLOOK
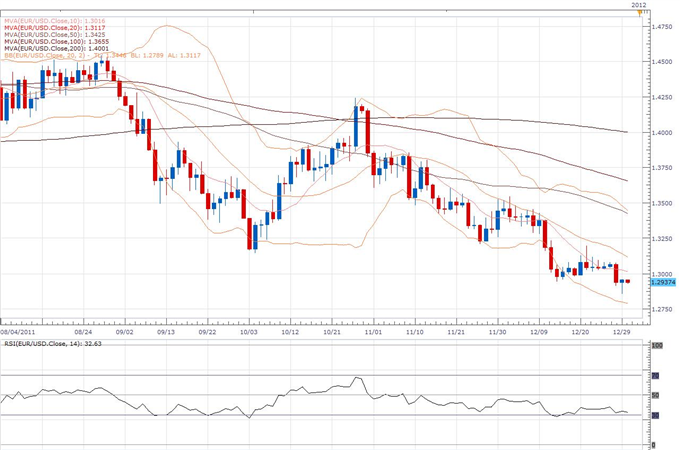
EUR/USD:
The market is now looking to establish below the critical 2011 lows
from January 2011 at 1.2870 and a weekly close below this level will
open the door for the next major downside extension towards the 1.2500
area. Overall, we retain a strong bearish outlook for this market and
look for setbacks to extend towards the 1.2000 handle over the coming
months. While we would not rule out the potential for corrective
rallies, any rallies should be very well capped above 1.3500.
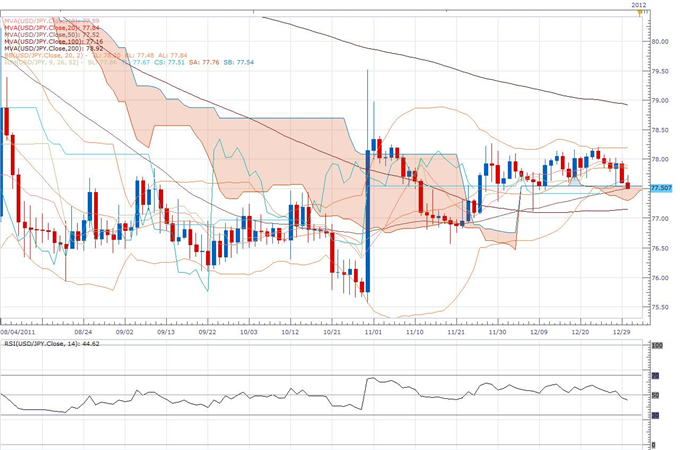
USD/JPY:The
market has managed to successfully hold above the bottom of the daily
Ichimoku cloud to further strengthen our constructive outlook and we
look for the formation of a inter-day higher low by 76.55 ahead of the
next major upside extension back towards and eventually through the
recent multi-day highs by 79.55. Ultimately, only a close back below the
bottom of the Ichimoku cloud would negate outlook and give reason for
pause, while a daily close back above 78.30 accelerates.
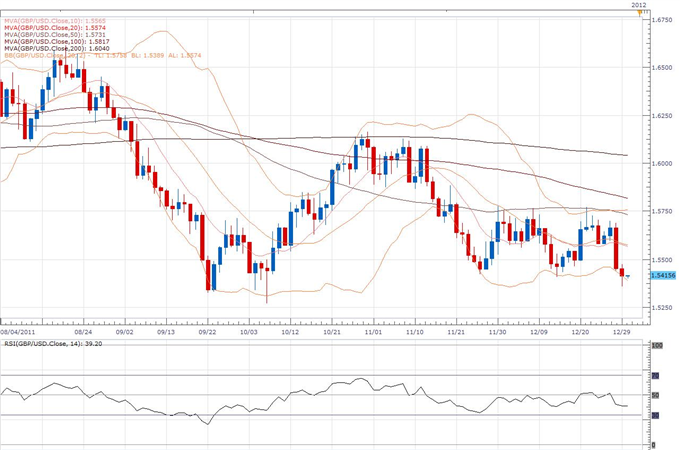
GBP/USD:
Rallies have been very well capped ahead of 1.5800 and it looks as
though a lower top has now been carved out by 1.5780 ahead of the next
major downside extension back towards the October lows at 1.5270. Key
support comes in by 1.5400 and a daily close below this level will be
required to confirm bias and accelerate declines. Ultimately, only back
above 1.5780 would negate bearish outlook and give reason for pause.
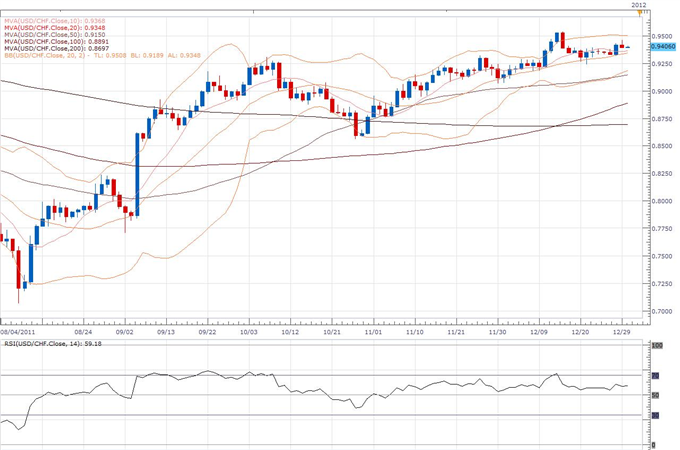
USD/CHF:
The recent break above the critical October highs at 0.9315 is
significant and now opens the door for the next major upside extension
over the coming weeks back towards parity. A confirmed higher low is now
in place by 0.9065 following the recent break over 0.9330, and next key
resistance comes in by 0.9785. Ultimately, only back under 0.9065 would
delay constructive outlook.
Written by Zeshan Muhammad Ali Awan
Technical Currency Strategist
Euro US Dollar Exchange Rate Forecast
Euro/US Dollar Technical Forecast
Monthly Chart
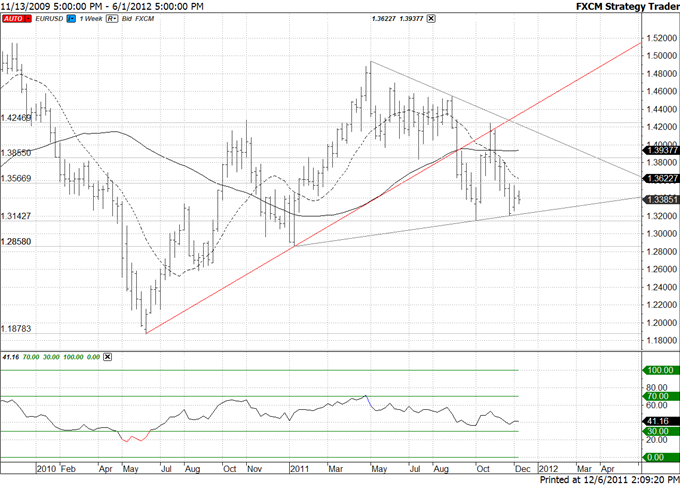
Prepared by Sarah Abbas
While a head and shoulders top may be forming from
the November 2010 top, don’t be surprised to see the EURUSD hold up for
at least another month. Recent COT data shows that commercials are long a
record number of contracts and non commercials (large speculators) are
nearly as short as they were at the 2010 bottom. One would expect
positioning to moderate before a true breakdown occurs. Resistance this month is 13565 and 13855. The obvious 13150 is support with a break exposing 12850 (January and 2011 low).
Euro / US Dollar Interest Rate Forecast
|
Currency, Central Bank
|
Euro,European Central Bank
|
US Dollar, US Federal Reserve
|
Net EURUSD Spread
|
Signal
|
|
1-Year Expectations(Basis Points)
|
(22)
|
5
|
(27)
|
Bearish
|
|
Yield in 1 Year(Percent)
|
1.03
|
0.30
|
0.73
|
Bullish
|
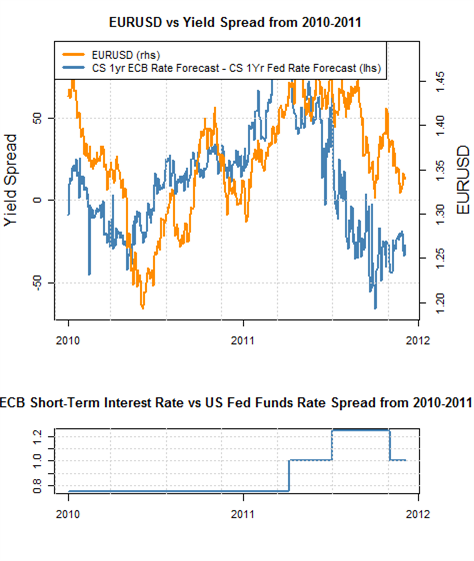
Euro/US Dollar Interest Rate Trading Bias: Neutral
Analysts predict that the
European Central Bank will cut interest rates by a modest 22 basis
points in the coming 12 months, while the US Federal Reserve will leave
interest rates unchanged. Relatively neutral yield expectations give
little reason to call for significant EURUSD declines. Yet to focus on
interest rates alone misses the real driver of recent EURUSD volatility:
European fiscal crises.
It seems as though European
governments are on the cusp of announcing the next significant
breakthrough in fiscal bailouts. Yet we’ve all heard this story before,
and the real truth is that substantial changes remain difficult.
We remain overall bearish the Euro against the US Dollar from a fundamental standpoint. Yet shorter-term sentiment analysis suggests that the EURUSD could rally through December before falling further in the New Year.
Euro / US Dollar Valuation Forecast
EURUSD Valuation Forecast: Bearish
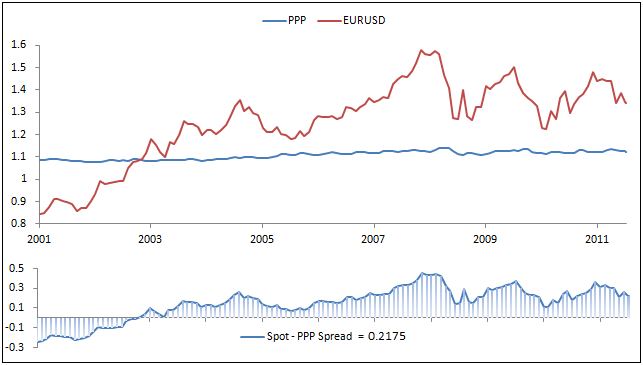
Source: Me and Ze Capital Management
The Euro
remains significantly overvalued against the US Dollar, trading 2175
pips or 16.23 percent above its PPP-implied fair exchange rate. The
greenback’s primacy as a safe haven as investors turn away the
intervention-hindered Japanese Yen and Swiss Franc calls for a deeper
correction of the value gap ahead as the Eurozone debt crisis continues
to weigh on market-wide risk appetite. Importantly, even if the currency
bloc’s policymakers finally craft a functional scheme to relieve
sovereign stress – most likely along the lines of an idea floated by
newly-minted ECB President Mario Draghi that proposes following a
credible plan for deeper fiscal integration with an expanded bond-buying
program from the central bank to reign in borrowing costs – the Euro is
likely to suffer nonetheless. Indeed, austerity measures are weighing
heavily on growth, meaning the ECB is likely to continue cutting
interest rates. Any QE-style program that emerges as part of the debt
crisis relief deal would naturally reinforce this trajectory.
What is Purchasing Power Parity?
One of the
oldest and most basic fundamental approaches to determining the “fair”
exchange rate of one currency to another relies on the concept of
Purchasing Power Parity. This approach says that an identical product
should cost the same from one country to another, with the only
difference in the price tag accounted for by the exchange rate. For
example, if a pencil costs €1 in Europe and $1.20 in the US, the “fair”
EURUSD exchange rate should be 1.20. For our purposes, we will use the
PPP values provided annually by Bloomberg. We compare these values to
current market rates to determine how much each currency is under- or
over-valued against the US DollarThe Professional Trader’s Friend: Trends | FXCM Expo 2011 | FXCM Expo
The Professional Trader’s Friend: Trends | FXCM Expo 2011 | FXCM Expo
Sponsored By Me and Ze Capital Management
Sponsored By Me and Ze Capital Management
Gold Respects Resistance - Sell Off Coming...
Gold Respects Resistance - Sell Off Coming?
Gold has been technically and fundamentally supported for several years. The technical patterns are beginning to break down which could mean the shiny metal has the potential to sell off from current levels.
A break below 1532 would confirm a new downtrend and offer a trader an entry to sell.
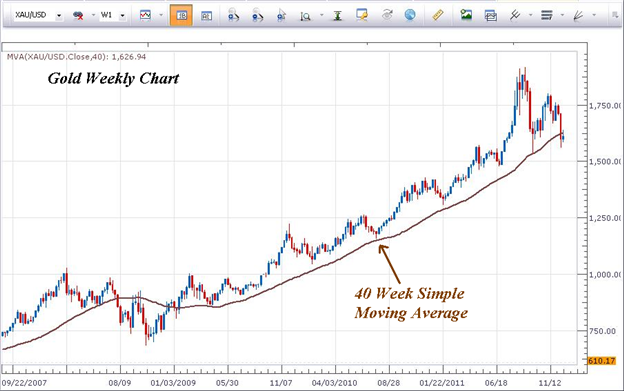
Last week, Gold broke below the 40 week moving
average for the first time since January 2009. This technical indicator
is watched by many large institutions to give clues about trend
direction.
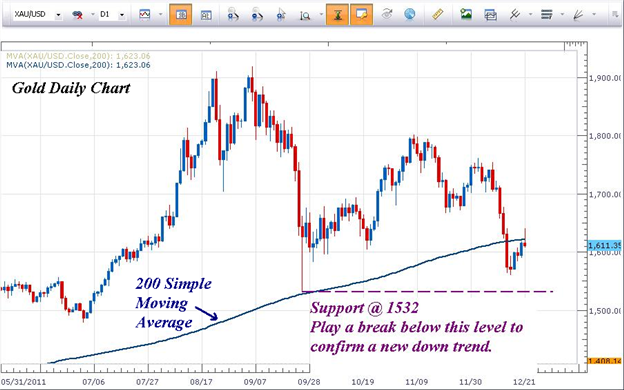
Additionally, Gold broke below the 200 Day Simple
Moving Average last week which is another technically bearish sign.
Earlier today, gold pierced the 200 SMA from the bottom side and
immediately turned lower. This respect for these important moving
averages indicates the appetite for owning gold at these prices is
waning.
Therefore, we’ll look for technical reasons to sell gold. Since the low of late September 2011 is
1532, place an entry to sell 1 point below at 1531. Prices trading to
these levels will indicate that prices are trading at levels not seen in
5 months which also indicates technical weakness. Place a stop just above a recent swing high on a break below 1531.
Crude Oil, Gold Expected to Decline as the New Year Begins
WTI Crude Oil (NY Close): $99.65 // +0.29 // +0.29%
European shares are little changed in early trade and S&P 500 stock index futures are treading water, pointing to neutral risk appetite trends and promising
a quiet end to the trading week and the year. Liquidity is almost
certainly evaporating as market participants wind down for the New Year
holiday, meaning any significant directional moves will likely wait
until 2012.
Looking ahead to January, risk aversion seems likely
to stage a comeback with the Eurozone debt crisis still unresolved and
global economic growth expectations pointing to a broad-based slowdown.
On balance, such an environment seems most supportive for safe-haven
assets like US Treasuries and the US Dollar at the expense of global shares and growth-geared commodities including crude oil.
On the technical front, prices put in a Hammer candlestick above resistance-turned-support at thetop
of a falling channel set from mid-November, hinting a pull-up is ahead.
Initial resistance lines up at 101.80. The channel bottom, now at
98.93, remains as near-term support.
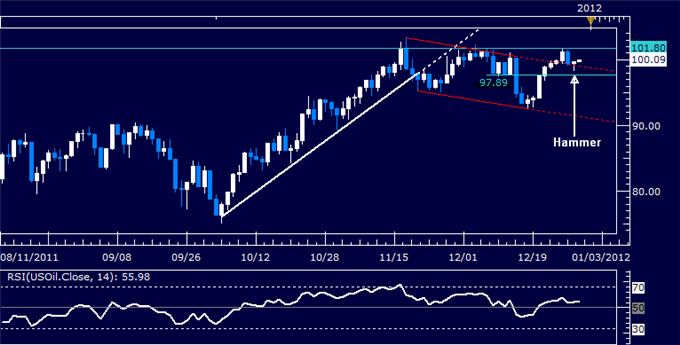
Daily Chart - Created by Zeshan
Spot Gold (NY Close): $1545.97 // -9.45 // -0.61%
With only hours left before global exchanges shutter
for the New Year holiday, little can be expected in terms of
significant directional momentum. Looking to 2012, the path of least
resistance appears to favor weakness as the Fed’s abandonment of QE saps
demand for gold as an inflation hedge while safe-haven capital inflows
boost the US Dollar, amounting to a de-facto headwind.
Sizing up the chart setup, prices are showing a
Hammer candlestick above support at 1532.45, the September 26 wick low,
pointing to a corrective bounce ahead after gold took out major multi-year trend line support
yesterday. Trend line resistance lines up at 1569.85. Renewed selling
through support initially exposes 1477.99, the July 1 low.
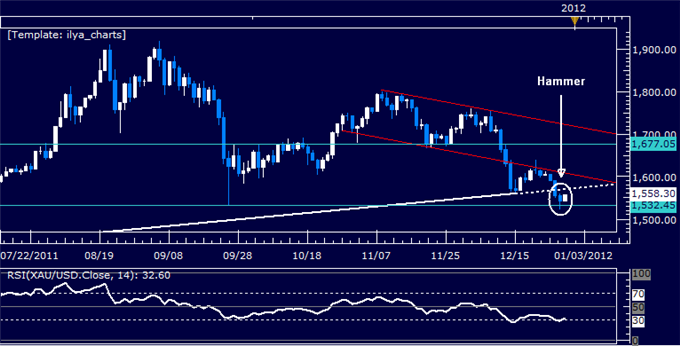
Daily Chart - Created by Zeshan
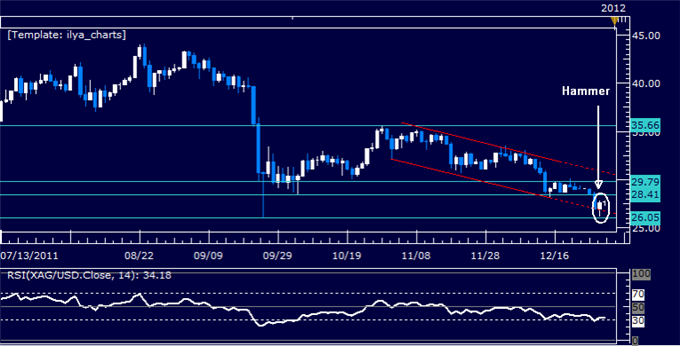
Spot Silver (NY Close): $27.70 // +0.59 // +2.19%
As with gold, the fundamental landscape appears to
favor weakness in the new year but little is likely to materialize in
the remaining hours of 2011. Prices put in a Hammer candlestick at the
bottom of a falling channel set from early November, hinting an upswing
is ahead. Near-term resistance is at 28.41, while the next significant
support level is marked by the September 26 low at 26.05.
Subscribe to:
Posts (Atom)